ABSTRACT
The energy sector currently accounts for 13% of gross world product. Its contribution is 25% bigger than that of the health sector and three times larger than the contribution of the agricultural sector. Energy is not only the biggest sector in the global economy, it is also one of the most important politically because of its association with climate change and socially due its large share in the budgets of the world’s poorest people. It is therefore a sector with which students, especially those studying Economics, should be familiar. This article focuses on the energy sector’s largest industry, oil. It is the first in a series of nine articles aimed at providing students with information that will enable them to better understand and analyse the economic, political, and social roles of each of the world’s major sources of energy.
INTRODUCTION
Classifications
The two main classifications of energy are into primary energy and secondary energy. Primary energy refers to original fuels that have not yet been converted into a form suitable for transport or use. The main sources of primary energy are oil, coal, natural gas, nuclear, hydro, wind, sun, geothermal, and biofuels. Secondary energy refers to fuels that have been converted into a form suitable for transport or use. The main forms are electricity, and liquid fuels such as petrol and kerosene. In this article, the author focusses on oil, the largest source of primary energy. Other forms of primary energy will be addressed in later articles.
Measurement
Energy is measured in terms of both physical quantity and energy (heat) content. Measures of physical quantity include barrels for crude oil, tons for coal, cubic metres for gas, and litres for petrol. The basic unit for energy content is a joule (the work done by a force of one newton acting through a distance of one metre). A watt (W) is one joule per second. Hence, a watt-hour (Wh) is 3.6 million joules, and a kilowatt hour (KWh) – the unit most households are familiar with - is 3.6 billion joules. In this article, the author uses terawatt/hours (TWh).
HISTORY
Oil has been used by humans as a source of energy for thousands of years. The earliest documented application is 347 BCE, when Chinese sourced it from wells up to 240 metres in depth (EKT Interactive, 2022). The oil provided heat that was used to separate brine into salt for cooking and fresh water for drinking.
The modern history of oil commenced around the mid-19th century. In 1846 a Canadian geologist, Abraham Gesner, developed a flammable liquid from coal, oil shale, and bitumen (The Canadian Encyclopedia, 2022). The new liquid was cheaper and cleaner than other oils. In 1859, Gesner formed the Kerosene Gaslight Company, which used it to light street lamps in Canada and, later, the United States.
In 1847 a Scottish chemist, James Young, discovered that natural petroleum seepage from a coal mine in Derbyshire, England, could be distilled into a light, thin oil suitable for lamps. In 1850 he and Edward Binney formed the world’s first commercial oil refinery, manufacturing the product from locally-mined coal. Although the venture was not a financial success due to declining mine output, Young later stated that “it had served a useful purpose, it had proved that petroleum could be turned to good account” (somercoteshistory, 2022).
In 1859, Edwin Drake drilled America’s first commercially productive oil well, in Titusville, Pennsylvania. Drake’s main technical contribution was to solve the problem of maintaining the stability of boreholes in the soil and loose rock that existed just below the surface. His solution was to use connecting sections of pipe until bedrock was struck. Drake found oil in the first well he drilled. However, he suffered a major setback when, a month later, his driller investigated the well while holding a lamp, and started America’s first well fire. Drake later gave up mining and, having failed to patent his drill-pipe method, lived the remainder of his life in relative poverty. However, his drilling technique led to a boom in exploration and within a few years oil became one of the most valuable commodities in America (Dave, 2008).
The late 18th early 19th centuries witnessed the formation of large oil companies, many of whose descendants remain among the largest companies on global stock markets. In 1865 in America, John D. Rockefeller founded the Standard Oil Company. By 1870, Standard Oil controlled more than 90% of America’s refining production and distribution capacity. In Russia, Ludwig and Robert Noble (brothers of the chemist, Alfred) controlled the domestic market. With the help of the Rothschild family, they built a railroad that connected the Caspian and Black seas, giving Russia physical access to major export markets. The Rothschilds soon became the dominant players in the Russian oil industry. In Britain, Royal Dutch Shell (which is registered in London) emerged from contracts with the Rothschilds to transport Russian oil to international markets. The discovery of oil in Iran in 1908 by William Knox D’Arcy led to the incorporation of the Anglo-Persian Oil Company (APOC), which later became British Petroleum.
From the 1920s to the early 1970s, the global oil industry was dominated by the so-called ‘seven sisters’ – seven vertically-integrated oil companies that were registered in the two largest oil-consuming countries, namely, the Unites States (five companies that have now morphed into Chevron, Exxon-Mobil, and Texaco), and Great Britain (now BP and Shell). For about five decades, these companies controlled up to 85% of global oil reserves and effectively acted as a cartel. Their operations were strongly influenced by the interests and politics of the main consuming countries (Sampson, 1991).
In 1960, five major oil producing nations – Iran, Iraq, Kuwait, Saudi Arabia, and Venezuela – formed the Organisation of the Petroleum Exporting Countries (OPEC). In 1968, OPEC challenged the control of the seven sisters by declaring that all countries have an inalienable right to permanent sovereignty over their natural resources. In October 1973, in response to a major disruption to energy supplies caused by the Yom Kippur War, OPEC doubled the price of its crude oil. In January 1974, it doubled the price again. These increases led to the first global economic recession since the 1930s. OPEC doubled the price of its oil again in 1979, following a disruption to supplies associated with the Iranian Revolution. This triggered another global recession, accompanied by record global inflation (a combination referred to as stagflation). The price increases led to efforts by consuming countries to diversify oil supplies, causing the share of oil supplied by OPEC members to fall from 56% in 1973 to 35% in 2021 (Statista 2022).
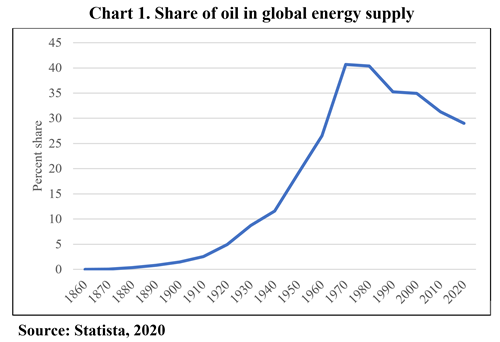
The oil price increases also reversed a long-term rise in the share of oil in the global energy market (Chart 1). During 1871-1973, oil production grew at an average annual rate (AAGR) of 8.7%, more than four times the corresponding rate for total energy (2.1%). As a result, the share of oil in global energy production increased from 0.1% in 1870 to 43% in 1973. During 1974-2021, the AAGR for oil was 0.9%, only half the AAGR for all energy. The sharp fall in its growth rate caused oil’s share in the total supply of energy to fall to 29% in 2021.
CURRENT SITUATION
Total energy consumption
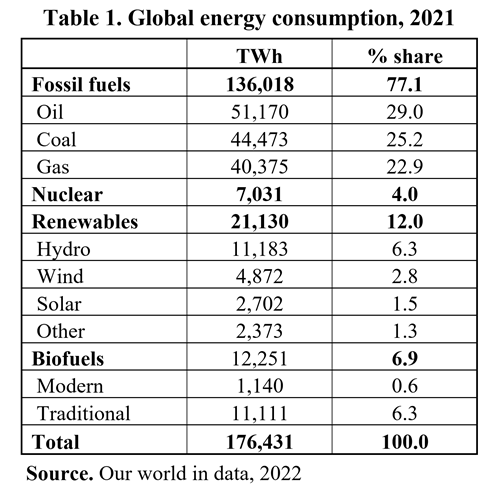
In 2021, the global consumption of energy amounted to 176,431 TWh (22.6 KWh per capita). Fossil fuels dominated, accounting for 77.1%, followed by renewables with 12.0%, biofuels 6.9%, and nuclear 4.0%. Oil supplied 37.6% of the energy from fossil fuels (Table 1).
Consumption of oil by country
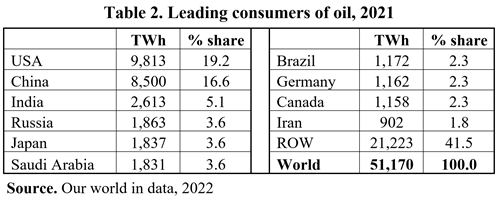
In 2021, the world consumed 51,170 TWh of oil, of which 96% was from current production and 4% was from stocks (Table 2). The leading consuming countries were the USA with 9,813 TWh and China with 8,500 TWh. These two countries accounted for 36% of global consumption. The share of India, the third leading consumer, was only 5.1%.
Production of oil by country
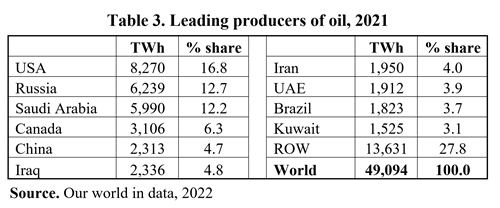
In 2021, global oil production amounted to 49,094 TWh. The USA was the largest producer, with 8,270 TWh, followed by Russia (6,239 TWh), and Saudi Arabia (5,990 TWh). These three countries accounted for 42% of global production. Only one of the top five producers was a member of OPEC. Venezuela, which has the world’s largest reserves of oil, produced only 389 TWh, less than 20% of what the country supplied before Hugo Chavez’s United Socialist Party of Venezuela assumed power in 1998.
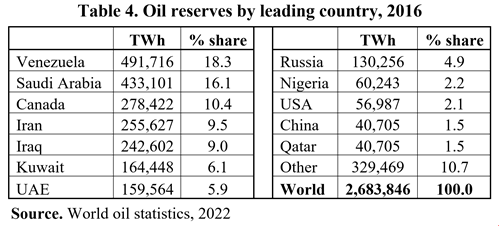
Reserves of oil by country
Known reserves of commercially viable oil amount to 2,683,846 TWh (Table 4). Five countries hold 63% of all reserves, with Venezuela (18.3%) and Saudi Arabia (16.1%) having the largest shares.
ADVANTAGES OF OIL
Oil has many advantages as a source of energy. They include low cost, an abundance of known reserves, high energy density, ease of transport, continuity of supply, and generation of valuable by-products.
The oil industry has been supplying the world with energy for about 170 years. During this period, the technologies that support production, transport, refining, and distribution have moved from first-of-a-kind (FOAK) to maturity stage. As a result, processes have been optimised at all stages along the supply chain, and even with very high taxes on its extraction (royalties) and use (excises), oil is among the cheapest sources of fuel for generating electricity and fuelling transport.
At the level of consumption in 2021 (51,170 TWh), known reserves are sufficient to meet the demand for oil for a further 52 years. If fossil fuels are viewed as transitional fuels until clean and more abundant sources such as fusion are available – perhaps in the 2050s – and allowing for further discoveries and efficiencies, oil can continue to be a leading supplier of energy during the transition period and beyond. It is very likely that much of the oil discovered will never leave the ground.
Measured in terms of megajoules per kilogram (MJ/kg), oil has high energy density, making it easy to store and transport before it is converted into energy. Also, oil is not dependent on the weather and can be used 24/7. It does not require the water to be flowing, the wind to be blowing, or the sun to be shining. Finally, while it is valued mainly as a source of energy, oil also produces important by-products such as plastics and cosmetics.
DISADVANTAGES OF OIL
Oil also has important disadvantages. Some of these tend to be overplayed by the media. For example, the extraction and transport of oil are associated with leakages and accidents that contribute to air, land, and water pollution. However, the impacts of these events are generally small and localised and – as with similar events in farming, forestry, manufacturing, and transport – have costs that are modest relative to their benefits. Also, the finite nature of oil reserves eventually limits the time frame over which oil can make a significant contribution to meeting the world’s demand for energy. However, currently known reserves do provide an innovative global economy with more than enough time to adjust. Also, according to Dale & Fattouh (2022). “new technologies, especially digitalisation in all its various guises, have the potential to unlock huge new reserves of oil over the next 20 to 30 years.”
On the other hand, some disadvantages are of considerable importance. They include the impact of the burning of oil on global warming, and the concentration of reserves in a small number of countries on energy security in other countries that are net importers of oil.
Global warming is perceived by a large proportion of the population to be a serious and even an existential threat. The burning of oil gives off large amounts of carbon dioxide and other greenhouse gases. As these accumulate in the atmosphere, more and more heat is trapped that would otherwise escape. This leads to an increase in global temperatures, a rise is ocean levels as ice caps melt, and perhaps more extreme weather events.
Countries accounting for more than 85% of gross world product (purchasing power parity basis) are net importers of oil. The countries with the five largest economies– China, USA, India, Japan, and Germany – are also the five largest net importers. These and most other economies rely heavily on oil for the production and transport of goods. As was demonstrated in the 1970s and early 1980s, disruptions to oil supplies can have a devastating effect on economic activity. Major net exporters of oil include Russia, Venezuela, and several Middle Eastern countries that might not, in all circumstances, be willing to guarantee supplies to all western countries.
OUTLOOK
Many organisations are providing scenarios for global oil consumption and production over the medium and longer terms. These scenarios produce widely different outcomes, sometimes even within the same organisation – for example, the International Energy Agency (IEA)’s Sustainable Development scenario proposes a fall in consumption of about 20% during 2021-45, while its Current Policies scenario suggests that, over the same period, consumption might rise by 25%. The most common view seems to be that consumption will continue to rise by about 1% a year until the middle 2040s, and sometime thereafter will level off and then may slowly decline. The implication is that oil will retain an important place in the consumption mix and may still be the dominant source of energy in 2045.
An important factor contributing to a continuing major role for oil is the likely fall in real oil prices. Rystad estimates that, in 2017, about 40% of the world’s oil supplies were produced at an average variable cost of less than $15 per barrel. However, the average price in that year was $54 a barrel (Statista, 2022). The gap between the price and average variable cost (a proxy for marginal cost) of oil represents a rent to producers. The existence and large size of this rent reflected the power of producers, through OPEC, to control supply. Compliance by OPEC members was supported by the view that oil was a scarce resource and that its underlying price would rise as reserves were used up.
However, there is now a general recognition that, over the transition period to new energy sources, oil will be abundant. During the last 3-4 decades, two barrels of oil have been added to estimates of reserves for every barrel of oil consumed (BP, 2022). New technologies, such as those associated with the extraction of tight oil, are also increasing supply capacity in non-OPEC countries. The view that a barrel of oil in the ground will be worth more tomorrow than today is being replaced by the perception that it might be safer to move assets from the ground to the bank. This change in assessment is likely to encourage low-cost producers to increase production, leading to lower prices, and strengthening of the demand for oil.
REFERENCES
BP’s Statistical Review of World Energy (https://www.bp.com/en/global/corporate/energyeconomics/statistical-review-of-world-energy.html.
Dave, U. (2008). Edwin Drake and the Oil Well Drill Pipe. https://www.pabook.libraries.psu.edu/literary-cultural-heritage-map-pa/feature-articles/edwin-drake-and-oil-well-drill-pipe
Dale, S. & Fatouh, B. (2022). Peak oil demand and long-run oil prices. https://www.bp.com/content/dam/bp/business-sites/en/global/corporate/pdfs/energy-economics/bp-peak-oil-demand-and-long-run-oil-prices.pdf.
EKT Interactive (2022). History of Oil. https://ektinteractive.com/history-of-oil.
Oil consumption (2022). https://ourworldindata.org/grapher/oil-consumption-by-country.
Oil production (2022). https://ourworldindata.org/grapher/oil-production-by-country.
Oil reserves (2022). https://ourworldindata.org/grapher/oil-reserves-by-country.
Sampson, A. (1991). The Seven Sisters: The Great Oil Companies and The World They Shaped. Amazon.
Statista (2022). https://www.statista.com/statistics/262860/uk-brent-crude-oil-price-changes-since-1976.
The Canadian Encyclopedia (2022). Abraham Gesner. https://www.thecanadianencyclopedia.ca/en/article/abraham-gesner
BIOGRAPHY

Angus Hooke is Emeritus Professor, Senior Scholarship Fellow, and Director of the Centre for Scholarship and Research (CSR) at UBSS. His earlier positions include Division Chief in the IMF, Chief Economist at BAE (now ABARE), Chief Economist at the NSW Treasury, Professor of Economics at Johns Hopkins University, and Head of the Business School (3,300 students) at the University of Nottingham, Ningbo, China. Angus has published 13 books and numerous refereed articles in prestigious academic journals.