ABSTRACT
While the overall share of fossil fuels in global energy consumption has been declining, that of natural gas has been increasing strongly, from 15% in 1965 to 22% in 2000 and 25% in 2021. This article, the third in a series of nine articles on the world’s primary energy resources, reviews the history of the natural gas industry and illustrates how a multi-criteria decision-making framework and a weighted sum methodology can be used to analyse the contribution of the industry to the global energy mix.
INTRODUCTION
Natural gas is a fossil fuel. Like coal, it has been formed over hundreds of millions of years by heat and pressure from overlying water, soil, and rocks. However, while coal is made from land-based plants deposited in bogs and coastal swamps, natural gas is derived from tiny marine organisms, such as algae and phytoplankton (US Library of Congress, 2022).
Natural gas contains many different compounds. The largest is methane (70-90%), a molecule composed of one carbon atom and four hydrogen atoms (CH4). Natural gas also contains small amounts of liquids and nonhydrogen gases such as carbon dioxide and water vapour. It is the lowest-carbon hydrocarbon and is non-corrosive and non-toxic. Natural gas is colourless and odourless, and a deodoriser such as mercaptan (which smells like rotten eggs) is usually added to it so that leaks can easily be detected (Energy explained, 2022).
Natural gas is bulky and highly flammable. To make it easier to transport and store, the gas can be converted to liquid form by being cooled to minus 162° Celsius. Liquid natural gas (LNG) has 1/600th the volume of natural gas and cannot be ignited.
The main uses of natural gas are in heating and electricity generation (one quarter of the world’s electricity is produced from natural gas). On a smaller scale, it is also used as fuel for aircraft, ships, buses, and automobiles (natural gas currently powers more than 5 million cars globally) and as feedstock in the manufacture of common products like fertilisers, paints, and plastics
HISTORY
Deposits of natural gas were recorded in ancient Greece, Persia (Iran), Iraq, China, and India. In about 1400 BCE, the shrine to the famous Oracle of Delphi was built around a spring where the seeping gas produced a continuing flame. While the gas was not commercialised, the Pythia (the priestess of Delphi), perhaps euphoric from breathing the gas (a mixture of carbon dioxide and methane can produce a psychological ‘high’), accumulated considerable wealth by providing cryptic answers to questions ranging from when and where to plant crops to the outcomes of possible wars and coup d’états. Around 500 BCE, Chinese in the Sichuan Valley captured gas as it seeped to the surface, transported it in crude pipelines made from bamboo, and used it to extract salt from brine.
In 1626, French explorers observed native Americans igniting gases that seeped from the ground near Lake Erie. In 1821, a gunsmith named Willian Hart, later regarded as ‘the father of natural gas’ in America, dug the world’s first commercial well outside Fredonia, New York. In 1836, Philadelphia created the first municipally owned gas distribution company, which is still the longest - and possibly also the largest - operating public gas system in the world. During the next few decades, gas was used widely as fuel for street and house lighting. Following the introduction of electricity in 1882, the industry’s market shifted from lighting to heating and cooking.
The share of gas in total energy consumption
Since the mid-1960s, the consumption of natural gas has been following a different trajectory to those of other fossil fuels. During 1965-2021, the combined share of oil and coal in total energy consumption fell from 78.9% to 58.4%. However, over the same period the share of natural gas rose from 14.6% to 24.7%. Natural gas increased its share in fossil fuel consumption from 15.6% in 1965 to 29.7% in 2021 Table 1).
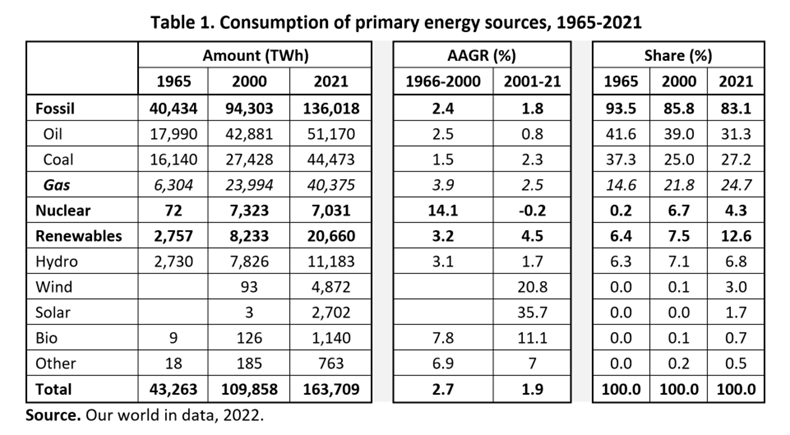
It is frequently stated in the popular media that renewables are the fastest-growing source of primary energy. In percentage terms, this is correct, and is due in part to their starting from a very low base – in 2000 - wind and solar together accounted for 0.1% of all energy consumed. However, renewables are not making the largest contribution to the growth of energy consumption. During 2000-21, global consumption of energy rose by 53,686 TWh, or 43.7%. The contribution of renewables to the increase was 12,367 TWh (23.5% of the total). By contrast, the contribution of natural gas was 16,309 TWh (30.5% of the total), while that of coal was even higher at 17,046 TWh (31.8%).
Consumption of gas by country
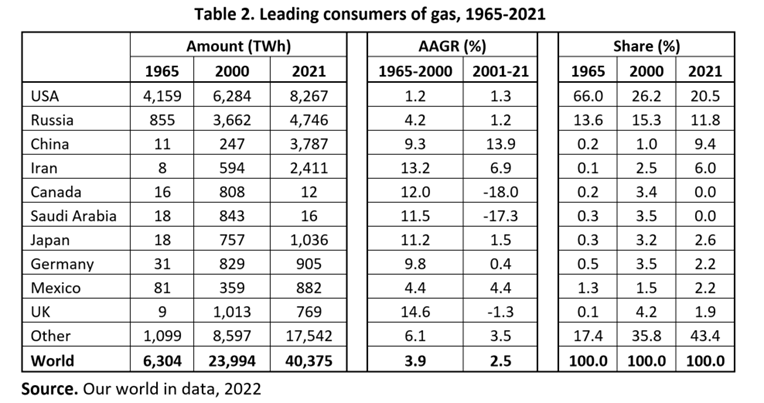
Table 2 shows the consumption of gas during 1965-2021 by the 10 countries that were the leading consumers of gas in 2021. In 1965, consumption in the USA and Russia accounted for 79.6% of the global total. Demand increased strongly in both countries in the late 20th century and the early part of the 21st century. However, their combined share in global gas consumption fell, to 32.3% in 2021. The countries with the biggest increases in shares were China and Iran and, to a lesser extent, Germany, and Japan.
Production of gas by country
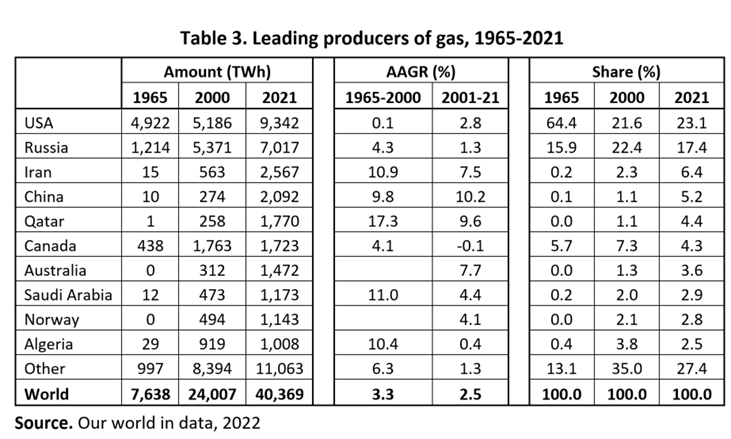
Table 3 shows the production of gas during 1965-2021 for the 10 countries that were the leading producers of gas in 2021. In 1965, the USA and Russia dominated, with shares of 64.4% and 15.9%, respectively. The US share fell to 21.6% in 2000 but has increased slightly since then due to the development of fracking technologies that allow natural gas to be extracted from shale formations. In 2021, the USA and Russia were still the leading producers, but with considerably lower shares than in 1965. The main increases in share were for China (to 9.4%) and Iran (6.0%).
Reserves of gas by country
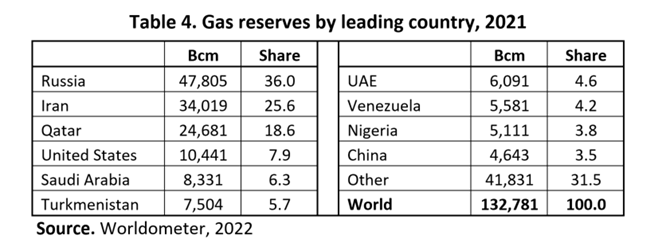
Table 4 shows known reserves of commercially viable gas, expressed in billion cubic metres (Bcm) for the world as a whole and for the 10 countries with the largest reserves in 2021. Russia has the largest share, at 36.0%, followed by Iran (25.6%) and Qatar (18.6%).
ANALYSIS
Approach
In this section, the author discusses how a Multi-Criteria Decision-Making (MCDM) framework and a Weighted Sum Method (WSM) of processing numerical estimates can be used to analyse and evaluate the contributions of different energy resources to the global energy mix. The approach can be applied to different scenarios, such as a constant-shares scenario or any of the three scenarios adopted by the International Energy Agency (IEA) in its World Energy Outlook reports.
The approach comprises six steps. First, criteria against which the energy resources are to be analysed are selected. Second, weights are assigned to these criteria. Third, raw (unweighted) numerical contributions (RNCs) are obtained for each energy resource in relation to each criterion. Fourth, the weights and RNCs are multiplied to produce weighted numerical contributions (WNCs). Fifth the WNCs for each energy resource are summed to produce an overall score (OS) for each energy resource. Finally, the OSs are ordered to provide a ranking of the energy resources.
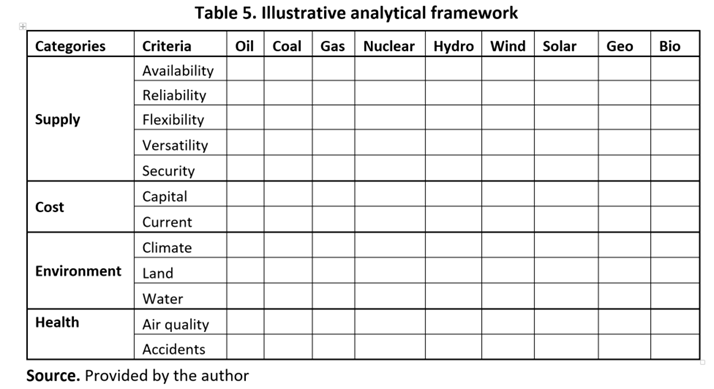
The illustrative list of criteria shown in Table 5 has been derived from the literature on energy, mainly the sections of articles, books, and video clips devoted to discussions of the advantages and disadvantages of specific energy resources. Fortunately, there is a high degree of overlap in the lists. The author of this paper has grouped the criteria into four categories: supply, cost, environment, and health. Supply focuses on energy availability, reliability, flexibility, versatility, and security. Cost examines the total costs but also discusses current and capital costs at various stages along the supply chain where overall cost estimates are not available. Environment includes climate, the quality of land and water resources, and biodiversity. Health focuses on accidents and other contributors to illness, disability, and premature death (Hooke, 2022).
To obtain data for weights and energy resource contributions (Steps 2 and 3), the author proposes holding a series of seminars attended by interested stakeholders and obtaining their estimates during the seminars. For weights, a benchmark criterion (e.g., flexibility of supply) might be selected, a brief discussion held to ensure a common understanding of its meaning and relevance in the particular context, and an arbitrary number assigned to it (e.g., 10). Then, for each of the other criteria, and again following a brief discussion of meaning and relevance, a score relative to the benchmark number would be assigned by each participant. The contributed weights would then be expressed as a fraction of 1 (one) or in percentage form and averaged across all participants. A similar approach would be taken to obtain raw data for the contribution of each energy resource against each criterion, but when presenting the results the top criterion score for each energy resource would be given the same number (e.g., 10).
Natural gas
This section contains a very brief review of information that might help seminar participants determine RNCs for natural gas. To provide a common framework, we take the period 2022-2050 as our time frame, 1.5% a year as the AAGR of global energy consumption, and maintenance of the share of natural gas in the total energy supply as our background scenario. The question is: Can and should the share of natural gas in total energy consumption be maintained at its 2021 level of 25%?
Availability
Availability refers to the ability of the energy resource to meet projected demand. According to IEA, reserves of natural gas can meet demand for 230 years at the 2021 rate of consumption. At a growth rate for consumption of 1.5% a year, they can meet demand for 50 years. So, even without the discovery of new reserves or the development and adoption of more efficient ways of producing natural gas, the resource should score very highly on availability. RNC = 8/10.
Reliability
Reliability refers to the probability that the resource will be able to meet demand at all times. Wind and sun should receive very low reliability scores. However, natural gas is not affected by the vagaries of weather and climate. Also, in the form of LNG, reserves can be stored in cryogenic tanks at consumption sites such as power-generating and steel-production plants. When demand is especially high, such as during periods of abnormally hot and cold weather, the LNG can be regasified for use as fuel. A study by Alec Lynn (2018), which compared natural gas with coal, wind, and solar, “concluded that natural gas comes out on top as the most reliable form of energy currently available.” The Met Group (2019) asserted “Natural gas is reliable … the use of this energy is guaranteed.” RNC = 9/10.
Flexibility
Flexibility refers to the ability to ramp up or scale back production. The more rapidly this can be done, the more suitable is the resource as a complement to renewables, whose production is highly dependent on weather and climate. If fuel is available, a gas-fired electricity-generating unit can provide power within a few hours, compared with a few days for coal-fired generators. Natural gas can therefore play a very useful ‘firming’ role as the world transitions to a higher-renewables-energy mix. With the volatility of the energy mix increasing as the share of renewables rises and the latter, on the assumptions above, rising from 12% in 2021 to 32% in 2050, the need for flexible resources will increase strongly. RNC = 9/10.
Versatility
Versatility refers to the range of uses for the energy resource. Renewables and nuclear score near to zero on this criterion. However, natural gas is used not only as fuel for electricity-generating plants, metal production, and transportation, but also as feedstock for a range of manufactured products. It is also safe and easy to store. RNC = 10/10.
Security
Energy security is defined by the IEA (2022) as “the uninterrupted availability of energy sources at an affordable price.” It is commonly separated from the reliability criterion by focussing it on the ability to respond quickly and effectively to adverse changes in the global political landscape and/or disruptions to international supply chains. Gas is more widely distributed globally than other fossil fuels and in the form of LNG is easy to transport and store. One shipload of LNG can provide enough energy to heat more than 40,000 homes for a whole year. When Japan shut down its nuclear reactors after the Fukushima disaster, it turned to LNG to make up much of the lost electricity supply. RNC = 8.
Costs
If markets were perfectly competitive and efficient, the long-run marginal cost of supplying a unit of energy at the stage of final consumption would be same for all providers and equal to the market price. If that were not the case, high-cost producers would reduce production until their marginal costs fell to the common market price and low-cost producers would increase production until their marginal cost rose to match the market price. However, the energy industry is littered with natural monopolies, organised monopolies like OPEC, and conferred monopolies such as municipal utilities. Also, most of the debate in the literature and media is not about the current but the expected future price.
The relevant question for this article is: Can the target energy resource (in this case, natural gas) provide the increase production implied in the scenario (a rise of 54%, to 62,176 TWh in 2050) at a price that is competitive with other sources of energy? Limited cost data have been collected for this paper. However, according to the IEA, the capital costs of the most efficient gas-fired electricity generating plant in the United States is $1,100 compared to $3,700 for the most efficient coal-fired plant. The US Department of Energy (DOE) has estimated that natural gas as a direct fuel can be one third the cost of electricity. Also, according to the Met Group (2019) “natural gas is one of the cheapest sources of energy.” Given the abundance of reserves, natural gas should score highly on cost. RNC = 9.
Environment
Environmental criteria comprise climate, weather, air quality, land quality, water quality, and flora and fauna biodiversity and populations. Of these, the one that is currently receiving the most attention is climate. For this criterion, the best source of energy is the one that contributes least to increasing the average global temperature.
Among the fossil fuels, natural gas makes the smallest contribution to global warming. It comprises mainly methane, which produces more energy by mass than coal and petrol refined from oil. While all fossil fuels produce carbon dioxide, which is a major greenhouse gas, natural gas emits 30% less carbon dioxide than does oil and 45% less than does coal.
However, methane that is emitted before burning is harmful to the environment. In the short term, it is 86 times more efficient at trapping heat in the atmosphere than is carbon dioxide. ‘Fugitive emissions’ of methane (emissions that occur at stages other than the burning stage) occur most commonly at the drilling stage (methane leaked into the atmosphere) and the transportation stage (methane leaked from pipelines). Critics of natural gas also point out that fracking is water intensive, causes micro earthquakes, and produces highly toxic and radioactive wastewater that can contaminate underground water supplies. However, the industry is working to reduce these effects by such measures as encasing gas-capture pipes at wells to prevent gas from contaminating the water table, making pipelines from better materials, and blending hydrogen with natural gas in pipelines (hydrogen burns more cleanly and reduces downstream air pollution and greenhouse gas emissions).
The burning of natural gas also makes the smallest adverse contribution to air quality. The burning of oil and coal releases nitrogen and sulphur oxides into the atmosphere, where they react with water vapour to form nitric and sulphuric acids. These can fall to Earth as acid rains. Natural gas does not emit sulphur oxide and produces 80% less nitrogen oxide than does coal. Gas-fired cars produce 97% less carbon monoxide and 25% less carbon dioxide than petrol-powered cars. RNC = 5.
Health and safety
Natural gas is the cleanest burning fossil fuel. The burning of oil and coal releases large amounts of emissions such as nitrogen oxides, sulphur dioxide, and harmful particles. However, the burning of natural gas emits only carbon dioxide and water vapour, two compounds we breathe naturally. RNC = 5.
Illustrative results for natural gas
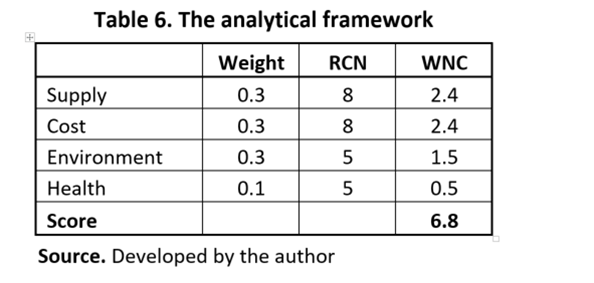
Table 6 provides a sample, summarised presentation of WNCs and OS for natural gas. The WNCs are derived by multiplying the weights and RNCs for each criterion. The OS is then obtained by summing the individual WNCs. When similar exercises are conducted for other primary energy resources a tentative ranking of the resources for the particular scenario envisaged can be obtained.
CONCLUSIONS
The main conclusions from the above analysis are:
- Natural gas is a rapidly growing source of energy. During 2000-21, it supplied 30.4% of the increase in global consumption, slightly behind the 31.7% share of coal, but well ahead of the combined 23.1% share of the three major renewable energies.
- Even with optimistic assumptions about the growth of renewables, the demand for reliable non-renewables will increase during the coming decades. If the AAGR of global energy consumption during 2022-2050 is 1.5%, absolute consumption will rise 95,269 KWh. If the AAGR of renewables were to be 5% a year, their contribution to increasing supply during this period would be 65,844 KWh. The growth in the absolute output of renewables would not come near to meeting the growth in absolute demand for energy.
- Reserves are more than sufficient for the industry to maintain its share in the global energy mix through to 2050.
- Natural gas is a cost-effective source of energy.
- Natural gas has a smaller adverse effect on the environment and health than other fossil fuels but a larger effect than nuclear or renewables.
- Harmful effects of gas production are being reduced as some governments and the industry continue to work together on regulatory controls and processes such as capture and storage that prevent the release of emissions into the atmosphere.
REFERENCES
https://www.worldometers.info/gas/
https://www.electronicspecifier.com/news/analysis/sun-sea-and-coal-which-energy-source-is-the-most-reliable
Birol, F. (2021). IEA. The World Energy Outlook, 2021. https://www.iea.org/reports/world-energy-outlook-2021
Editors (2022). BP’s Statistical Review of World Energy (2022). https://www.bp.com/en/global/corporate/energyeconomics/statistical-review-of-world-energy.html.
Editors (2022). Energy education. https://energyeducation.ca/encyclopedia/coal_types.
Editors (2022). Energy explained. https://www.eia.gov/energyexplained/coal.
Editors (2022). Energy data. https://ourworldindata.org/grapher/energy-consumption-by-source-and-region,
Editors (2022). BP’s Statistical Review of World Energy (2022). https://www.bp.com/en/global/corporate/energyeconomics/statistical-review-of-world-energy.html.
Hooke, A. (2022). Primary energy markets – coal. https://www.ubss.edu.au/articles/2022/october/primary-energy-markets-coal/
Pletcher, K. (2022). Rhondda. https://www.britannica.com/place/Rhondda.
US Library of congress (2022). https://guides.loc.gov/oil-and-gas-industry/history.
Wikipedia (2022). Natural gas. https://en.wikipedia.org/wiki/Natural_gas.
BIOGRAPHY

Angus Hooke is Emeritus Professor, Senior Scholarship Fellow, and Director of the Centre for Scholarship and Research (CSR) at UBSS. His earlier positions include Division Chief in the IMF, Chief Economist at BAE (now ABARE), Chief Economist at the NSW Treasury, Professor of Economics at Johns Hopkins University, and Head of the Business School (3,300 students) at the University of Nottingham, Ningbo, China. Angus has published 13 books and numerous refereed articles in prestigious academic journals.