ABSTRACT
Achieving the environmental goal of eliminating the use of fossil fuels depends not only on the expansion of other sources of energy but also on the growth of demand for energy. An earlier article in this series described and analysed the demand for energy over the four decades ended 2020. The present article constructs a model for developing scenarios of the future demand for energy. It then applies this model to the preparation of three scenarios for energy demand during the remaining decades of the 21st century. The scenarios illustrate the risks in pursuing a narrow and short path for achieving net zero emissions, and how a wider and longer path might produce a better balance between and among returns and risks, especially for the poorest 4 billion of the world’s population.
INTRODUCTION
Many proponents of cleaner energy sources – especially the intermittent sources of wind and solar – also recommend that new investments in the fossil fuel industries (oil, coal, and natural gas) be banned (IEA, 2023). The feasibility of this approach depends partly on the pace at which the supply of cleaner energies can be increased. However, it also depends on the growth of demand for energy. The International Energy Agency (IEA, 2023) argues that the global demand for energy must fall by an average of 1% a year if the goal of net zero emission (NZE) of greenhouse gases by 2050 is to be reached. This article develops three scenarios of energy demand in order to consider the plausibility of the IEA demand requirement. It also discusses some implications of the scenarios for the risks involved in trying to achieve this goal while seeking to both ban new investments in fossil fuel production and discourage the expansion of nuclear power generation.
THE FRAMEWORK
Based on the consumption of energy during 1980-2020 (Hooke, 2023) and forecasting approaches used by other researchers (e.g., IEA, 2023), the framework adopted in this article considers the roles of three factors that influence the demand for energy – population, per capita income, and the efficiency of energy production and use. Other things being equal, the higher population and per capita income the greater is the demand for energy-dependent products, and the higher energy efficiency is the lower is the amount of energy needed to make these products.
Population
Projections of population are derived from the UN Population Division’s median variant forecasts. The author uses the 160 countries in the Division’s forecasts for which significant historical data are also available for three other key variables in the author’s World Energy Model, namely labour force, labour productivity, and per capita consumption of energy. The 160 countries are divided into four groups: High-income countries (HICs), Upper-middle-income countries (UMICs), Lower-middle-income countries (UMICs), and Low-income countries (LICs). The allocation among the groups is based on each country’s per capita income in 2020, using purchasing power parity data published in the CIA’s The World Factbook. There are 40 countries in each group (see Appendix for a list of these countries).
Per capita income
Projections of per capita income are obtained from the author’s World Income Model. The structure of that model is derived from the following identities:
| PCY = GDP / PN | (1) |
| GDP = V * LF | (2) |
| LF = PPR * PN | (3) |
| Hence: | |
| PCY = (V * PPR * PN) / PN | (4) |
| PCY = V * PPR | (5) |
Where:
- PCY is per capita income;
- GDP is gross domestic product, measured in 2020 international dollars (I$);
- V is labour productivity, also measured in 2020 international dollars (I$);
- LF is the labour force; and
- PPR is the population participation rate – i.e., the proportion of the population that is in the labour force.
Projections of labour productivity are based mainly on convergence theory. This theory divides economic eras into three phases - breakaway, catch-up, and fine-tuning. It also divides economies into technology leaders and technology followers. The growth process begins with the emergence of a new technology, such as farming about 12,000 years ago, industrial technology a little more than two centuries ago, and digital technology in the late 20th century. During the breakaway phase the technology leaders (e.g., Western Europe, North America, and Oceania in the industrial era) adopt the new technology and enjoy a higher rate of labour productivity growth than do the technology followers (South America, Asia, and Africa in that era). In the catch-up phase, the followers also adopt the now more sophisticated technology and, because they have access to the latest version and normally receive considerable training and other assistance from the technology leaders, quickly close their productivity gap with these countries. In the fine-tuning phase, where participants seek to extract the remaining benefits from the now mature technology, leaders and followers have similar levels of productivity. (For a discussion of convergence theory, see Hooke [2022]).
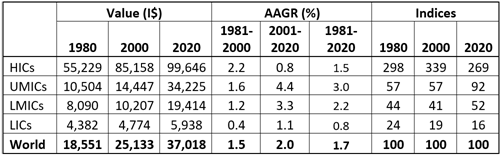
Table 1. Labour productivity, 1980-2000
Source: Constructed by the author from the World Bank’s World
Economic Indicators and the CIA’s The World Factbook.
Table 1 shows the value of labour productivity, measured in 2020 international dollars, during 1980-2020. The data support the view that technology convergence is playing an increasing and now major role in the growth of the world economy. In the HICs, the average annual growth rate (AGGR) of labour productivity was lower in the first two decades of the 21st century than in the last two decades of the 20th century while in both the two middle-income groups and the low-income group it was about three times higher. In 2001-20, the AAGR of labour productivity was 5.6 times higher in the UMICs than in the HICs, 4.1 times higher in the LMICs, and 1.3 times higher in the LICs.
Changes in the population participation rate (PPR) cause changes in PCY to diverge from changes in productivity. In 2020, the global average PPR was 44%. However, it was 49% in the HICs, 41% in the LICs, 38% in the LMICs. The HICs were therefore enjoying a demographic gift of 5 percentage points (pp) while the LICs and LMICs were shouldering demographic burdens of 3pp and 6pp, respectively. One worker was supporting 2 persons in the HICs, but 2.5 persons (25% more) in the LMICs and LICs. Since the demographic variables that determine PPRs, such as birth and mortality rates, are also converging across income classes, it can be expected that systematic differences in PPRs will decline and probably disappear over the course of the present century.
Per capita consumption of energy (PCCE) is highly correlated with income. As demonstrated by Hooke (2023), it explained 97% of the differences in PCCE among countries in 2020. However, the relationship was weak within the 20 countries that had the highest PCY. The data suggest that the effect of rising incomes on energy consumption weakens considerably once PCY exceeds about I$40,000 (2020 prices).
Energy efficiency
The efficiency with which raw materials are extracted and converted into energy (production) and with which that energy contributes to final products (utilisation) has increased considerably in recent decades. Being relatively new industries, solar and wind experienced huge increases in production efficiencies in the first two decades of this century. Utilisation efficiencies were also considerable. Fuel efficiency in motor vehicles increased by 60% during 1980-2010 (Washington Post, 2012) and that of energy used to power air-conditioning systems rose by 50% during 2011-20 (Energy Rating, 2022). Given the emphasis being placed on energy efficiencies to combat climate change, increasing adoption of existing technologies - such as insulation, programmable thermostats, air sealing, heat pumps, and pool covers - and development and application of new technologies should continue to drive energy efficiencies. There is, however, also the danger that market interventions providing support for less efficient technologies will moderate and even offset these improvements.
THE SCENARIOS
In this section we describe three scenarios for energy demand over the remainder of this century: a Reference Scenario, in which rates of change in the global technology frontier and energy efficiency continue at their 2001-20 rate and the pace of convergence is moderate; a High-Economic-Growth Scenario, in which the technology frontier moves outward and convergence occurs more rapidly than in the Reference Scenario; and a Low-Efficiency-Growth Scenario, in which the rate of improvement in energy efficiency is halved but other assumptions are the same as the High-Economic Growth Scenario.
The Reference Scenario
Population
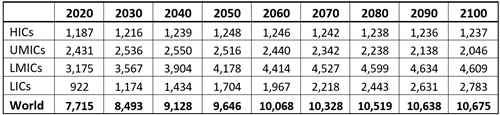
Table 2 shows the projections for population during the forecast period (2030-2100). Total population rises by 25% in the first three decades, to 9.6 billion in 2050, and by a further 11% in the latter half of the century, to 10.7 billion in 2100. Over the eight decades to 2100, the projected increase is 38%, compared with 240% during the eight decades immediately prior to 2020.
Table 2a. Global population by income groups, 2020-2100
(millions)
Source. UN Population Division, published in Statista (2023).
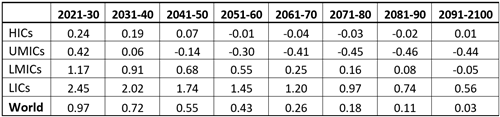
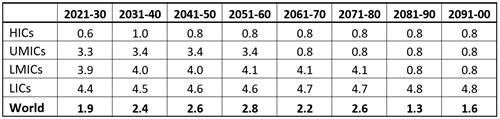
The annual growth rate of population peaked in 1969, at 2.1%. It then declined to 1.3% in 2000 and 1.0% in 2020. Table 2b, which is derived from Table 2a, shows the average annual growth rates (AAGRs) of population during the scenario period. The rate continues to decline in all decades, to only marginally above zero in 2100. It is negative or zero during the last four decades for the HICs and during last six decades for the UMICs (which include China). By 2100, it is significantly positive only in the LICs, but for this group is still only a quarter of its 2021-30 rate.
Table 2b. Global population by income groups, 2020-2100
(average annual growth rates, in %)
Source. Table 2a.
Table 2c shows the changes in the distribution of population during 2020-2100. The shares of the HICs and the UMICs decline consistently, that of the LMICs increases to 2050 and then levels off, and the share of the LICs more than doubles.
Table 2c. Global population by income groups, 2020-2100
(shares in %)
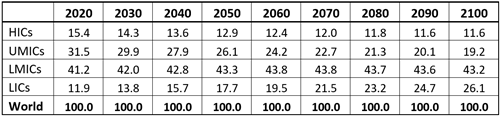
Source. Table 2a.
Per capita demand for energy
The Reference Scenario assumes that labour productivity in the HICs, which is constrained by the global technology frontier, will continue to grow at its 2001-20 rate of about 0.8%; within the HIC group, individual country productivity levels will converge on the group average by 2040; and the convergence process for labour productivity will be completed in the UMICs by 2060, the LMICs by 2080, and the LICs by 2100. The scenario also assumes that the PPR in the HICs will be unchanged, the rates in the three follower groups will converge on the HIC rate, and the pattern of PPR convergence will be the same as that for labour productivity.
Table 3 shows the implications of these assumptions for the growth rates of PCY during the projection period. AAGRs during the catch-up period of income convergence are 3.4% in the UMICs, 4.0% in the LMICs, and 4.6% in the LICs. These rates are quite low compared to South Korea’s 7% during 1961-2100, China’s 8% a year during 1981-2010, and Hong Kong’s 9% a year during 1970-2000 (Statista, 2023). After convergence has been achieved the rate is, of course, 0.8% in each follower group, the same as in the HICs.
Table 3. Growth of per capita income, 2021-2100
(average annual growth rates, in %)
Source: World Income Model developed by the author.
During the four decades to 2020, per capita income explained 97% of the differences in per capita consumption of energy among individual countries. Accordingly, the Reference Scenario assumes that convergence of per capita income among countries will be accompanied by convergence of per capita demand for energy - i.e., these convergences will also be completed in 2060 in the UMICs, 2080 in the LMICs, and 2100 in the LICs.
However, convergence behaviour cannot be applied to the HICs; they are the technology leaders, not technology followers. Also, the relationship between per capita income and per capita consumption of energy among these countries during 2001-20 was quite weak. Per capita consumption of energy in the HICs actually declined by 13% during that period (Hooke, 2023). This decline does not imply that, at high levels of income, energy-dependent products are negative goods. A rise in income is unlikely to cause a rich person to use less cooling services in summer or heating services in winter, drive a smaller car a shorter distance, or take fewer international flights in more crowded seats. Also, wealthier countries are more likely to engage in new, high-energy-intensive activities such as exploring and establishing settlements in space. However, performance during 2001-20 does suggest that the income elasticity of demand for energy-dependent products (YEDE) might be quite low in the HICs. We set this elasticity in the HICs at 0.1 – i.e., a 10% rise in PCY leads to a 1% increase in per capita consumption of energy-dependent products in these countries.
During 2001-20, PCY in the HICs rose by 20%. Assuming YEDE of 0.1, the increase in PCY would have contributed a 2% rise in their per capita demand for energy (PCDE). We attribute the gap between the implied and the actual growth of PCDE in these countries, of 15pp, to improvements in the efficiency of energy production and use. We also assume that this rate of improvement, which translates into an AAGR of 0.7%, continues throughout the remainder of the 21st century.
Table 4 shows the implications of these assumptions for PCDE over the scenario period. During the first three decades, PCDE falls by 15% in the HICs, to 44,372 kWh, rises by 35% in the UMICs, and more than doubles in the LMICs and LICs. Global PCDE rises by 16%, to 23,360 kWh. Over the eight decades to 2100, PCDE falls by 37% in the HICs and rises by only 20% in the HMICs. However, it increases by 300% in the LMICs and by 1,600% in the LICs. Globally, the PCDE rises by 64%, to 33,164 kWh in 2100.
Table 4. Per capita demand for energy, 2020-2100 – Reference Scenario
(kWh)
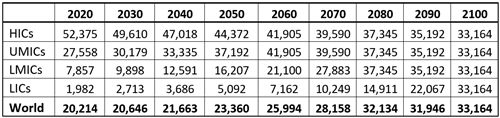
Source: World Energy Model developed by the author.
Total demand for energy
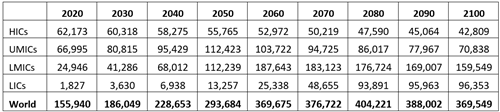
Table 5a shows the total demand for energy by the four income groups and the world. During the three decades to 2050, demand falls by 11% in the HICs. However, it rises by 40% in the UMICs, 170% in the LMICs, and 370% in the LICs. With global population increasing by 25% and global per capita demand rising by 16%, the total demand for energy during 2021-50 grows by 44%, to 225,324 TWh. During the latter half of the century, demand falls by 26% in the HICs and 27% in the UMICs. It doubles in the LMICs and increases 11-fold in the LICs. Globally, demand rises by 57% during this period, to 354,018 TWh in 2100.
Table 5a. Total demand for energy, 2020-2100 – Reference Scenario
(TWh)
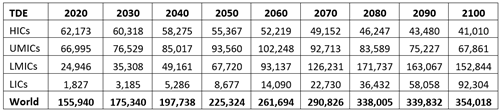
Source: World Energy Model developed by the author.
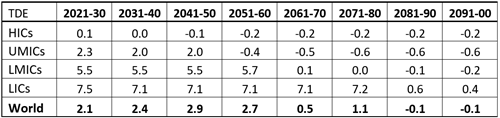
Table 5b shows the AAGRs for energy demand over the scenario period. The rate is negative in all decades for the HICs, in the last four decades for the UMICs, and in the last two decades for the LMICs.
Table 5b. Growth of demand for energy, 2021-2100 – Reference Scenario
(AAGR in %)
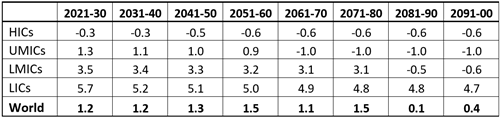
Source. Table 5a.
The High-Economic-Growth Scenario
In the High-Economic-Growth (HEG) Scenario, we assume that the AAGR of labour productivity in the HICs (the technology leaders) will be 1.5%. We also assume that convergence of PPRs, labour productivities, and PCDEs will be advanced to 2050 for the UMICs, 2070 for the LMICs, and 2080 for the LICs.
It is plausible that the AAGR of labour productivity in the HICs will be higher than the 0.8% assumed in the Reference Scenario. First, the rate during 1981-2000 was 2.2% and special rather than systematic factors may have caused the sharp reduction in 2001-20. Of more importance is the likelihood that digital technology will be replaced as the dominant growth technology sometime during this century.
Historically, technological eras have been getting shorter and more powerful. If we take the very long-term view, the foraging era of the Australopithecines (the predecessors of humans) was about 4 million years, the scavenging era of Homo habilis was around 2 million years, the hunting era introduced by Homo erectus was about 1 million years, the farming era was around 12 thousand years, and the industrial era was approximately 200 years. The AAGR of average labour productivity was very low but nevertheless rising in the first three eras, was about 0.02% during the farming era, was 1% during the industrial era, and was 2% in the first two decades of the digital era (Hooke, 2020).
It is difficult to say what the future drivers of economic growth will be but biotechnology and robotics are promising candidates. Biological improvements in the coming decades will reduce disease, improve physical and mental abilities, and produce higher and more sustainable levels of energy. Robotic technology in the middle and later part of the century could provide a labour force that can work 24/7/365 and, because the robots (including some we might regard as synthetic humans) would not be limited to biological materials, could be orders of magnitude stronger, faster, and more intelligent than even biologically-enhanced humans. As in earlier eras, while the current AAGR of labour productivity is high compared to rates in these earlier eras, it may be quite low compared to rates in future eras.
It is also likely that convergences will occur more rapidly than specified in the Reference Scenario. The pace of labour productivity convergence depends on many factors, but performance in eastern and southern Asia over the last six decades demonstrate the importance of a healthy and educated population as well as policies supporting free trade, foreign direct investment, personal safety, and preservation of property rights. Improvements in medicine, information & communication technologies, and transport are speeding up the transfer of knowledge, best practices, and complementary resources in all these areas. A process that took 60 years commencing in the third quarter of the 20th century should take much less time beginning in the early part of the 21st century.
Table 6a shows the demand for energy in the HEG Scenario. Because the income-elasticity of demand is assumed to be very low at high levels of income, the new assumptions in the HEG scenario have little effect on demand in 2100 – it is only 4% higher than in the Reference Scenario. However, demand is 30% higher in 2050 and 41% higher in 2060. The much higher growth rates of energy consumption in the coming four decades is due overwhelmingly to the speeding up of labour productivity, PPR, and PCDE convergence in the middle- and low-income countries.
Table 6a. Total demand for energy, 2020-2100 – HEG Scenario
(TWh)
Source: World Energy Model developed by the author.
Table 6b shows the AAGRs for total energy demand in the HEG Scenario. The rate remains negative in the HICs in all decades. For the other groups, it is medium to high in the first four decades but declines in the later decades. Globally, the rate rises in the first three decades, generally falls in the next three decades, and is negative in the last two decades of the century.
Table 6b. Total demand for energy, 2020-2100 – HEG Scenario
(TWh)
Source. Table 6a.
The Low-Efficiency-Improvement Scenario
It is also plausible that the efficiency of energy production and use could be lower than in the earlier scenarios. The risk applies mainly to the production of energy, not the efficiency with which energy is used. For the latter, global markets operate largely unimpeded, allowing prices to accurately reflect the true opportunity costs of different choices by consumers and producers. Hence, it can be expected that, as time passes, standard-sized cars will cover more kilometres per gallon/kWh, heaters and coolers will use less electricity to change room temperatures, and factories will need less energy to produce energy-dependent goods and services.
However, the generation of energy is a different story. Well-meaning interventions are being made to substitute solar and wind – and, to a lesser extent, hydro – for fossil fuels and nuclear energies. There are two major problems with this approach: first, these inappropriately-named renewable resources need huge amounts of complementary resources just to generate energy (mainly electricity); and second, since wind and solar are unreliable and largely unpredictable sources of energy, they require backup from more reliable sources of supply.
Sunshine and wind do not directly feed usable power into transmission lines. A wide range and large amounts of mainly non-renewable resources are needed to harvest their thermal and kinetic energy and convert these energies into electricity. For example, the construction of a typical 2-megawatt (MW) turbine uses about 1,180 tonnes of concrete, 270 tonnes of steel, 45 tonnes of iron, 20 tonnes of fibreglass, 4 tonnes of copper, and 16 tonnes of other materials – a total of 1,535 tonnes. For wind to provide just 20% of primary energy in 2050, 40 million 2MW turbines would be needed. Turbines are replaced every 20 years or so, either because they have worn out or because they become obsolete. So, in a steady state situation, 2 million of these turbines would need to be replaced every year. The best sites for harvesting wind are normally on hills, not on flat farmlands where populations are concentrated. So, once the land has been set aside, access roads built, and the turbines installed, additional transmission lines need to be built, using more non-renewable and scarce resources. Also, once the best sites have been exploited, less suitable and even more distant sites must be accessed, leading to diseconomies of scale that seem almost certain to constrain improvements in overall energy efficiency.
The amount of backup required to support intermittent energy sources depends on the variability of the latter’s supply, the availability and cost of storage, and the willingness of communities to live with blackouts and brownouts. The speed and reliability of wind vary geographically and over time. Winds blow more strongly during the day, in winter, at high latitudes, and over oceans. Wind is also subject to longer-term cyclical variation - the global average wind speed (GAWS) declined steadily from 13.8 kph in the 1960s to 11.3 kph in 2001-10. The total reduction over the five decades was 23%. For energy storage, considerable progress has been made with large-scale batteries, and they are useful for matching unpredictable supply with more predictable demand over very short periods. However, they start to lose power after about four hours, and cannot cope with mismatches over long periods. Public tolerance of unreliability may be high among parts of the population that are near the top of Maslow’s hierarchy of needs and so place considerable value on belonging, esteem, and self-actualisation. However, it is much less so among the 4 billion people in the world who are moderate to low consumers of energy.
The LFG Scenario assumes that focussing growth in energy supply on wind and solar and the diseconomies of scale these may face as they move into less favourable and more distant locations and face more community scrutiny will halve the AAGR of improvements in energy efficiency, to 0.35%. All other assumptions of the HEG Scenario are maintained.
Table 7a shows the demand for energy in the LFG Scenario. Total demand rises by 110% during the three decades to 2050 and by a further 150% in the following five decades, to 491,900 TWh in 2100. Compared to the HEG Scenario, demand is 11% higher in 2050 and 33% higher in 2100.
Table 7a. Total demand for energy, 2020-2100 – LFG Scenario
(TWh)
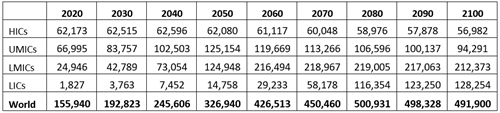
Source: World Energy Model developed by the author.
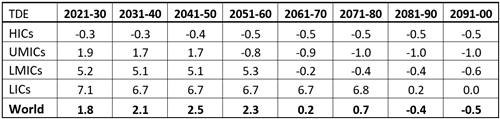
Table 7b shows the AAGRs in this scenario. The rate peaks in the 2040s, at 2.9%, follows a falling trend in the following three decades, and is slightly negative in the last two decades of the century.
Table 7b. Total demand for energy, 2020-2100 – LFG Scenario
(TWh)
Source. Table 7a.
DISCUSSION
Of the three scenarios developed in this article, the Reference Scenario provides the easiest challenge to achieving the goal of ZNE while replacing some or all fossil fuels with mainly intermittent sources of energy. This scenario has the slowest rate of technology frontier expansion; the slowest rate of labour productivity, population participation, and PCDE convergence; and the highest rate of energy efficiency improvement. However, even this scenario suggests that global demand for energy will increase by 44%, or about 69,000 TWH over the three decades to 2050 (Table 8).
Table 8. Implications of Focus on Intermittents and ZNE
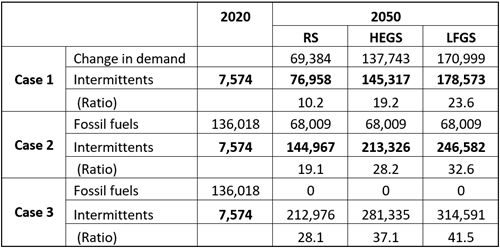
Source. Tables 7a, 7b, 7c and Hooke 2023.
In 2021, intermittent sources (wind and solar) produced approximately 7,600 TWh of energy – 4.5% of the global total. In that year, fossil fuels generated 136,000 TWh, accounting for 83% of the global supply. The production of intermittent energies would have to be ten times higher in 2050 (AAGR = 8.0%) just to accommodate the increase in global energy demand implied in the Reference Scenario. To replace fossil fuels by 2050, the supply of intermittents would have to rise 19-fold (AAGR = 10.3%). The required increases would be much smaller in the HICs where total energy demand is projected to fall and considerable investments in technology and transmission lines have already occurred. They would have to be much higher in the LMICs (mainly southern Asia and northern Africa) and the LICS (overwhelmingly sub-Saharan Africa).
However, the Reference Scenario is not the most likely scenario. It is more plausible that exponential growth in research outputs will speed up the outward movement of the global technology frontier and that improvements in communications and transport will facilitate economic and energy convergence. The HEG Scenario may be more probable than the Reference Scenario. It is also plausible that the forced growth of intermittents will lead to diseconomies of scale that slow down the overall improvement in the efficiency of energy production, suggesting that the LFG Scenario is the most likely of all three. In any case, it would seem prudent to consider the magnitude of the challenge of achieving ZNE by 2050 under the latter scenarios and some of the possible effects of adopting overly challenging policies for pursuing this goal.
Table 8 indicates that, to cover the projected increase in demand during 2022-50, supply from intermittents would have increase 19-fold under the HEG Scenario and 24-fold under the LFG Scenario. If new investments in fossil fuels were banned immediately and as a result the supply of fossil fuels were halved by 2050, the supply of intermittents would need to increase 28-fold under the REG Scenario and 33-fold under the LFG Scenario. To replace fossil fuels fully, the supply of intermittents would have to rise 37-fold under the HEG Scenario and 41-fold under the LFG Scenario.
What would happen if, by 2050, energy from fossil fuels were to be reduced by 50%, nuclear energy were to be unchanged, other relatively reliable sources of energy (hydro, geothermal, and biofuels) were to increase at their relatively high 2001-20 rates (AAGR = 2.4%), and intermittents were to rise at an AAGR of 10%? Table 9 shows that, in the Reference Scenario, supply would more than meet demand – there would be excess supply of about 800 TWh. However, there would be shortfalls of 60,000 TWh (23% of demand) in the HEG Scenario and 101,000 TWh in the LFG Scenario (31% of demand). The shortfalls would be concentrated in low-income countries where demand increases most rapidly and the ability to increase supply of intermittents is lowest (e.g., Middle Africa). The excess demand would cause prices to rise until energy purchased matched available supply. Those on lower incomes would reduce purchases most as prices rise. The process of adjustment would end when aggregate quantity demanded has been cut back to the level of available supplies. The incidence of the cutbacks would be overwhelming on several billion of the world’s lowest-income consumers.
Table 9. Market outcomes for 10% AAGR in Intermittents
(TWh)
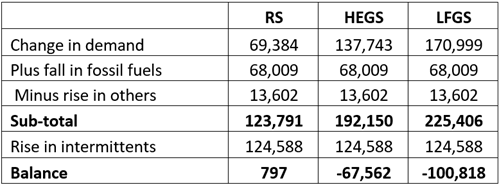
Source: Compiled by the author.
The HEG Scenario and the LFG Scenario highlight the risk involved in adopting a highly ambitious goal for energy production and use (ZNE by 2050) while at taking an aggressively negative approach toward fossil fuels and nuclear energy. The impact of large energy shortfalls, especially on lower-income people, could be devastating.
This suggests that we should consider adopting an approach to energy management that places greater emphasis on ensuring that energy supply is able to meet energy demand without large increases in energy prices. This could include placing more weight on adaption to whatever changes in climate - for better or worse – may occur. Even if human-induced greenhouse gases are reduced to zero, we will still need to adapt to non-human-caused climate change. The global mean temperature (GMT) is rising now partly because, about 15,000 years ago, a 110,000-year ice age ended and the current warming period commenced. Had this not occurred, the human population would still be about 4 million, hunting and scavenging would be the dominant economic activities, annual per capita income would be about US $100, and life expectancy would be around 18 years. Present population, living standards, and civilisation itself exist because of climate change. Temperatures are also rising because, in about 1800, a mini-ice age was replaced by the present mini-warming period, which also boosted agricultural production and living standards. Even if the energy sector were to achieve ZNE by 2050, remaining in the warming phase of both a major and a minor climate cycle would still require policies and practices of adaptation.
Also, we have already shown that we have the ability and willingness to adjust. Take, for example, coping with rising sea levels. Currently, about 110 million people (27 times more than the global population 15,000 years ago) live below sea level, protected by walls and other coastal defences. It has been suggested that, because of climate change (including the part due to cyclical factors), this number could rise to 150 million by 2050 and 200 million by 2100. The costs of including some adaptation in the policy mix must be compared with the benefits of increasing energy security for millions to several billions of poor people in both low- and high-income countries.
A more balanced approach could also include levelling the playing field for nuclear energy. Nuclear is the only energy source that is both clean and reliable. It does not require expensive sources of backup supply or mega-kilometres of additional transmission lines to get the power to users. The direct cost is high in Western countries largely because its generation is capital-intensive, and activists have added unnecessary regulatory barriers that have doubled or tripled construction times. In South Korea, where a more objective stance has been taken, construction times have fallen since 2000. Capital intensity could also be reduced by using small nuclear reactors. These can be used as modules in reactors of any size, offering the opportunity to reap huge economies of scale. Currently the small reactors are also expensive. However, just as the efficiency of wind and solar plants fell considerably as the technologies matured, so could similar gains be expected from small reactors if all unreasonable regulatory barriers were removed.
It is widely accepted that population growth will continue to decline and could be negative before the end of this century. It is also likely that, as the middle-and low-income countries move through the catchup phase of the labour productivity and per capita income convergence process, the growth of per capita demand for energy will decline. Once the convergence process is completed, it will require only a modest increase in energy efficiency for the global demand for energy to decline. At that time, the cost of moving to ZNE would be declining every year and the burden could be spread evenly among all countries. It will be argued by many that climate change is an existential threat and that the window for eliminating it is only a few decades. However, doomsday predictions have an as-yet unbroken habit of being wrong and, as Greta Thunberg has implicitly acknowledged, some climate-change predictions already fit into this category (News, 2023).
CONCLUSIONS
Rising population and progress toward convergence of per capita demand for energy will increase the global demand for energy during 2021-50. The three scenarios discussed in this article set the increases in the range of 44-110%. However, demand in the high-income countries is projected to decline during this period, by 0.1-11%.
The AAGR of energy demand will decline during the following three decades, with the level in 2080 being 38-53% higher in 2050. Over this period, demand will continue to fall in the high-income countries (by 5-15%) and will also decline in the upper middle-income countries (by 11-24%). It will slow down in the lower-middle-income countries but will remain high in the low-income countries.
Not only the growth but also the level of global demand can be expected to fall in the last two decades of the century. By 2100 global population will have ceased increasing, convergence of per capita demand for energy may be completed, and improvements in energy efficiency could more than offset the low growth of demand for energy-dependent products.
In light of this temporal pattern of energy demand – strong in the next few decades but more modest and eventually negative in the latter half of the century - and the concentration of demand growth in middle - and low-income countries, there may be a case for widening the vehicle for reductions in energy-emissions from simply demand reduction and promotion of intermittent sources of supply. This widening could include adaptation to changes in climate – especially as long- and short-term cyclical factors will still influence climate even if anthropomorphic factors are eliminated - and levelling the playing field on the supply side to allow nuclear (the cleanest source of reliable energy) to expand in the high-income countries as it doing anyway in the increasingly more important middle- and low-income countries.
REFERENCES
Energy Rating (2022). https://www.energyrating.gov.au/products/space-heating-and-cooling/air-conditioners.
Hooke, A. (2022). Primary energy markets – Oil. Post-COVID Reflections on Unit Content and Delivery, Assessment, and Student Engagement. Intertype.
Hooke, A. (2022). Primary energy markets – Coal. Post-COVID Reflections on Unit Content and Delivery, Assessment, and Student Engagement. Intertype.
Hooke, A. (2022). Primary energy markets – Gas. Post-COVID Reflections on Unit Content and Delivery, Assessment, and Student Engagement. Intertype.
Hooke, A. (2022). Primary energy markets – Nuclear. Post-COVID Reflections on Unit Content and Delivery, Assessment, and Student Engagement. Intertype.
Hooke, A. (2022). Primary energy markets – Hydro. Post-COVID Reflections on Unit Content and Delivery, Assessment, and Student Engagement. Intertype.
Hooke, A. (2023). The global demand for energy – 1980–2020. https://www.ubss.edu.au/articles/2023/march/the-global-demand-for-energy-1980-2020.
IEA (2023). Global energy review. https://iea.blob.core.windows.net/assets/d0031107-401d-4a2f-a48b-9eed19457335/GlobalEnergyReview2021.pdf.
News (2023). Greta Thunberg accused of quietly deleting tweet that said ‘humanity would be wiped out’ if fossil fuels not cut by 2023. https://www.news.com.au/technology/environment/climate-change/greta-thunberg-accused-of-quietly-deleting-tweet-that-said-humanity-would-be-wiped-out-if-fossil-fuels-not-cut-by-2023/news-story/9371a37b8dc701520fa1238b72e76276
Washington Post (2012). https://www.washingtonpost.com/blogs/ezra-klein/post/where-did-the-missing-fuel-efficiency-go/2012/01/05/gIQA9UcmcP_blog.html.
BIOGRAPHY


Angus Hooke is an Emeritus Professor, Senior Scholarship Fellow, and Director of the Centre for Scholarship and Research (CSR) at UBSS. His earlier positions include Division Chief in the IMF, Chief Economist at the NSW Treasury, and Professor and Head of the Business School (3,300 students) at the University of Nottingham, Ningbo, China. Since early 2019, Angus has published 15 refereed articles, authored one book on Economics, and been Chief Editor of seven books (four with Professor Greg Whateley, all for the UBSS CSR).