
ABSTRACT
Efforts to achieve the goal of net zero emissions of green-house gases focus mainly on the supply side of the energy market – on encouraging the substitution of energy sources that have low emissions, such as intermittent renewables and nuclear, for those that have higher emissions, predominantly oil, coal, and gas. It is recognised, however, that the magnitude of the problem depends also on the demand for energy and that demand can be influenced by public policies and community attitudes. This article is the first of a set of three articles on the demand for energy. It describes energy consumption (a proxy for energy demand) overall, by regions and their major energy-consuming countries, and by income levels during 1980-2020, and tries to identify the main forces driving energy consumption during this period. It will be followed by articles on the outlook for energy demand during the remainder of the 21st century and on measures that might contribute to constraining demand during that period.
INTRODUCTION
Since the Berlin Wall was torn down in 1979, triggering a 4-fold increase within one month in membership of environmental groups focussing on climate change, energy has been the sector of prime interest for the media, political groups, environmental activists, and – though to a lesser extent – the general public. The sector is widely blamed for generating, directly or indirectly, most of the green-house gases that cause human-induced global warming. Hence, efforts to combat global warming concentrate on constraining the demand for energy and encouraging its supply in ways that minimise green-house gas emissions. Earlier articles in the UBSS Publications Series have focused on the benefits and costs of some of the major energy-supplying industries – oil, coal, gas, nuclear, and hydro. This article addresses the demand side of the equation. It focuses on the consumption of energy by geographical regions, major countries, and per capita income groups during 1980-2020. Its aim is to gain insights that can be used to generate plausible scenarios of future global energy demand.
ENERGY CONSUMPTION BY REGION AND COUNTRY
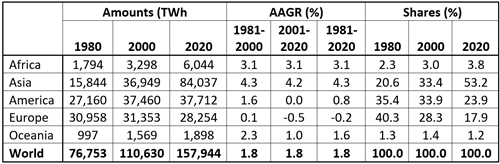
Table 1 provides an overview of the global and regional consumption of primary energy during 1980-2020. Global consumption increased from 76,753 terawatt hours (TWh) in 1980 to 157,944 TWh in 2020. Its average annual growth rate (AAGR) for the period was 1.8%. Among the regions identified, growth was highest in Asia at 4.3% and Africa at 3.1%. It was lowest in Europe at minus 0.2% and in America at 0.8%. These markedly different growth rates led to large changes in regional shares. In 1980, Europe had the largest share, at 40%; by 2020, its share had more than halved, to 18%. America’s share declined by a third, to 24%. On the other hand, Asia’s share rose 2.6-fold, to 53% in 2020. In that year, Asia’s energy consumption was a fifth larger than the combined share of America and Europe. From a low base – comparable to that of Asia in the 1960s – Africa’s share increased by more than half, to 3.8% in 2020.
Table 1. Demand for energy by geographical region, 1980-2020
Source. UBSS Energy consumption model, using data published by Statista,
the US CIA (The World Factbook), and the UN’s Population Division.
Africa
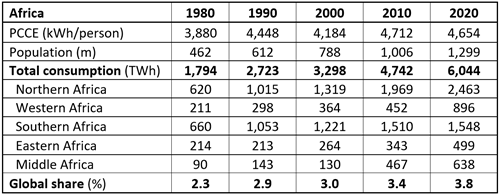
In 1980, per capita consumption of energy (PCCE) in Africa amounted to 3,880 kilowatt hours (kWh), about one fifth of the global average. With a population of 462 million (11% of global population), Africa’s total energy consumption was 1,794 TWh, and accounted for 2.3% of global energy consumption. In 1981-2000, population growth was the main driver of Africa’s energy consumption. During this period, PCCE rose by only 20% while population increased by 180%. Accordingly, total consumption rose more than threefold – the second highest regional increase – to 6,044 TWh. Over the four decades, Africa’s share of global energy consumption increased by more than half, to 3.8% (Table 2a).
Table 2a. Demand for energy in Africa, 1980-2020
Source. UBSS Energy Consumption Model, which uses data published by Statista,
the US CIA (The World Factbook), and the UN’s Population Division.
Energy consumption in sub-regions of Africa
In 2020, the largest consuming region in Africa was Northern Africa (41% of the regional total), followed by Southern Africa (26%), and Western Africa (15%). Growth was highest in Middle Africa (a more-than-7-fold increase during 1981-2020), followed by Western and Northern Africa (four-fold increases), and Southern and Eastern Africa (where consumption more than doubled). From relatively low bases, all African regions increased their shares in global energy consumption (Table 2a).
The five major energy-consuming countries in Africa
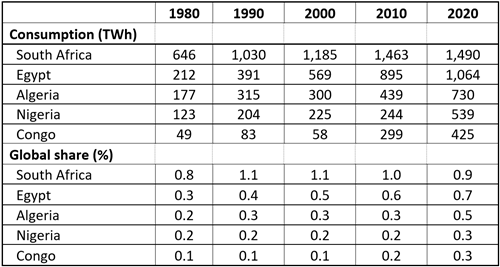
The five largest energy-consuming countries in Africa in 2020 were South Africa, Egypt, Algeria, Nigeria, and the (Democratic Republic of the) Congo. During 1981-2020, consumption rose 9-fold in the Congo, 5-fold in Egypt, and more than 4-fold in Nigeria and Algeria. From low bases, all five countries increased their shares in global energy consumption during 1981-2020. (Table 2b).
Table 2b. The largest country consumers of energy in Africa, 1980-2020
Source. UBSS Energy Consumption Model, which uses data published by Statista,
the US CIA (The World Factbook), and the UN’s Population Division.
Asia
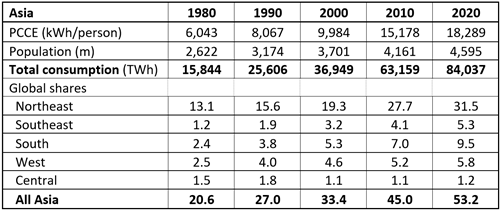
In 1980, Asia’s PCCE was 6,043 kWh (35% of the global average) and population was 2,622 million (61% of global population). Its total energy consumption, of 15,844 TWh, accounted for 20% of global consumption. During the following four decades, the AAGRs of PCCE and population were 2.8% and 1.4%, respectively, resulting in AAGR for total consumption of 4.3%. By 2020, Asia’s consumption of energy had risen to 84,037 TWh and its share in global consumption had increased to 53%. Asia had become the dominant buyer in the global energy market (Table 3a).
Table 3a. Demand by regions in Asia, 1980-2020
Source. UBSS Energy Consumption Model, which uses data published by Statista,
the US CIA (The World Factbook), and the UN’s Population Division.
Energy consumption in sub-regions of Asia
During 1980-2020, Northeast Asia was by far the largest energy consumer in Asia. Its energy consumption also rose strongly over the four decades and its share in global consumption increased by 18 percentage points (pp), to 31% in 2020. South Asia was the third largest energy consumer among the five regions in 1980. Its share in global consumption rose by 7.1pp during 1980-2020, to 9.5% in 2020 – second largest share in the region. However, the AAGR of energy consumption was highest in Southeast Asia, at 5.7%, and its global share increased more than fourfold, to 5.3% (Table 3a).
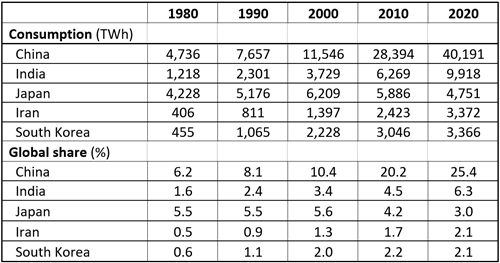
The five major energy-consuming countries in Asia
Table 3b. Demand by major energy-consuming countries in Asia, 1980-2020
Source. UBSS Energy Consumption Model, which uses data published by Statista,
the US CIA (The World Factbook), and the UN’s Population Division.
The five leading consumers of energy in Asia in 2020 were China, India, Japan, Iran, and South Korea. Over the four decades to 2020, China’s consumption rose 8.5-fold, and its share in global consumption quadrupled, to 25.4%. Growth of PCCE accounted for 83% and growth of population for the remaining 17% of this growth. India’s energy consumption also rose more than 8-fold, and its share of the global total increased to 6.3%. Growth of PCCE accounted for about two-thirds and growth of population for the remaining one third of the increase. Energy consumption in Japan rose in the last two decades of the 20th century but fell in each of the following two decades, almost halving the country’s share of global energy consumption to 3.0% in 2020. Energy consumption rose 8-fold in Iran and 7-fold in South Korea, and the global shares of each quadrupled to 2.1% in 2020. In both countries but more so in South Korea, rising PCCE was the major contributor to energy consumption growth.
America
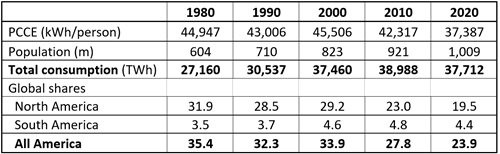
In 1980, PCCE in America amounted to 44,947 kWh (2.6 times the global average). With a population of 604 million (14% of the global population), America’s total energy consumption was 27,160 TWh and comprised 32% of global consumption. America’s PCCE rose slightly during the following two decades but fell sharply in the first two decades of the 21st century. For the four-decade period, the AAGR was minus 0.4% for PCCE and (plus) 1.3% for population. As a result, while America’s total energy consumption rose by 39% over the four decades, to 20 37,712 TWh, its share in global consumption fell by about a third, to 24%. In 1980, America consumed 71% more energy than did Asia; in 2020, it consumed 55% less. (Table 4a).
Table 4a. Demand for primary energy in America, 1980-2020
Source. UBSS Energy Consumption Model, which uses data published by Statista,
the US CIA (The World Factbook), and the UN’s Population Division.
Energy consumption in sub-regions of America
In 1980, North America (the USA, Canada, Mexico, and the Caribbean) accounted for 32% of global consumption of energy and South America (middle America and continental South America) for 3.5%. Over the following four decades, the AAGR of energy consumption was 0.6% in North America and 2.4% in South America, resulting in a decline in the global share of North America, to 19%, and a rise in that of South America, to 4.4%. During this period, North America relinquished its position as the leading sub-region consumer of energy to Northeast Asia: in 1980, North America consumed 2.4 times as much energy as Northeast Asia; in 2020, it consumed less than two-thirds as much (Tables 3a and 4a).
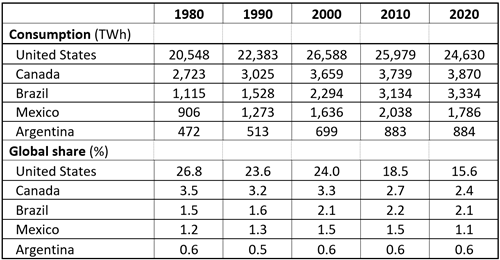
The five major energy-consuming countries in America
In 2020, the five leading consumers of energy in America were the United States, Canada, Brazil, Mexico, and Argentina. In the United States, consumption increased strongly in the last two decades of the 20th century but fell slightly in the following two decades. Over the four decades, the country’s share of global consumption declined by 11pp, to 16%. In 2020, US consumption of energy was 4.3 times the consumption of China; by 2020, it was less than two thirds that of China. Among the top five American energy-consuming countries, only Brazil increased its global share during 1980-2020.
Table 4b. Demand by major countries in America, 1980-2020
Source. UBSS Energy Consumption Model, which uses data published by Statista,
the US CIA (The World Factbook), and the UN’s Population Division.
Europe
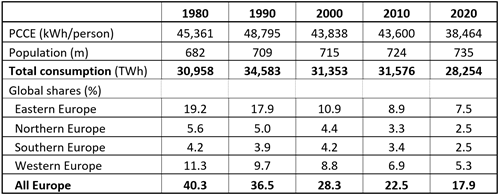
In 1980, per capita consumption of energy (PCCE) in Europe was 45,361 kWh (2.6 times the global average). With a population of 682 million (16% of global population), Europe was the world’s leading energy consumer, accounting for 40% of the global amount. During 1981-2020, PCCE in Europe declined by 15% while population increased by a modest 8%. Accordingly, Europe’s total consumption fell by 9% and its share in global consumption more than halved, to 18% - one third the share of Asia (Table 5a).
Table 5a. Demand for primary energy in Europe, 1980-2020
Source. UBSS Energy Consumption Model, which uses data published by Statista,
the US CIA (The World Factbook), and the UN’s Population Division.
Energy consumption in sub-regions of Europe
During 1980-2020, energy consumption fell in all European sub-regions except Southern Europe, where it rose by 24% – but still less than a quarter of the global rate of increase. Accordingly, the shares in global energy consumption fell markedly in all four sub-regions. The largest declines were in Eastern Europe – 11.7pp, to 7.5%, and Western Europe – 6.0pp, to 5.3%. (Table 5a). The global shares of all four European sub-regions in 2020 were very small compared to that of Northeast Asia (31%) and were also significantly lower than that of Southern Asia (9.5%).
The five major energy-consuming countries in Europe
Table 5b. Demand by major countries in Europe, 1980-2020
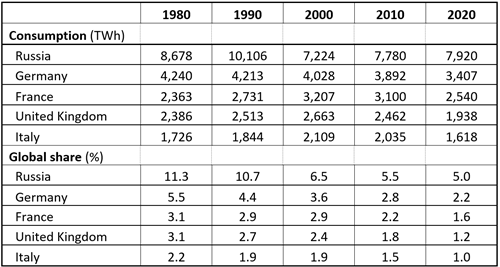
Source. UBSS Energy Consumption Model, which uses data published by Statista,
the US CIA (The World Factbook), and the UN’s Population Division.
In 2020, the five leading consumers of energy in Europe were Russia, Germany, France, the United Kingdom, and Italy. During 1981-2020, energy consumption rose by 7% in France and fell by 6-19% in the other four countries. By 2020, only Russia with 5.0% of the global total and perhaps also Germany with 2.2% were significant buyers in the global energy market (Table 5b).
Oceania
In 1980, PCCE in Oceania amounted to 45,131 kWh (more than 2.5 times the global average). With a population of 22 million (0.5% of global population), the region’s total energy consumption was 997 TWh, more than half that of Africa at the time. During 1981-2020, Oceania’s PCCE rose by only 3.2%. However, population increased by 85%, and total consumption grew by 90%, to 1,898 TWh. In 2020, Oceania’s global share, while about the same as in 1980, was just under one-third the share of Africa. (Table 5).
Table 5. Demand for primary energy in Oceania, 1980-2020
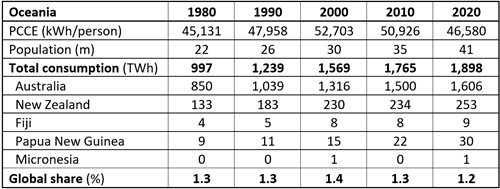
Source. UBSS Energy Consumption Model, which uses data published by Statista,
the US CIA (The World Factbook), and the UN’s Population Division.
ENERGY CONSUMPTION BY PER CAPITA INCOME LEVELS
Total energy consumption is the product of population and PCCE. Virtually all studies indicate that PCCE is strongly influenced by PCY. In this section, we consider how strong the relationships were in 1980, 2000, and 2020. These are static analyses, showing how sensitive PCCE is to differences in PCY. We also conduct a dynamic analysis, looking at how sensitive PCCE is to changes in PCY over time.
To facilitate these analyses, we divide the 160 countries in the UBSS Global Income Model into eight groups based on per capita income (PCY) in 2020. PCY is measured in terms of purchasing power parity, with the unit referred to as an international dollar (I$). The eight groups in descending order of PCY are: the High-Income Countries 1 (HIC-1), the High-Income Countries 2 (HIC-2), the Upper-Middle-Income Countries 1 (UMIC-1), the Upper-Middle-Income Countries 2 (UMIC-2), the Lower-Middle-Income Countries 1 (LMIC-1), the Lower-Middle-Income Countries 2 (LMIC-2), the Low-Income Countries 1 (LIC-1), and the Low-Income Countries 2 (LIC-2). Each group contains 20 countries (See Appendix).
Table 6a shows key characteristics of each group. The largest shares in global population were in UMIC-2 (26%), which includes China, and in LMIC-2 (31%), which includes India. The table indicates a wide disparity in PCYs – the average in HIC-1 was 18 times the level in LIC-1 and 37 times that in LIC-2.
Table 6a. Key Characteristics of the Eight Income Groups
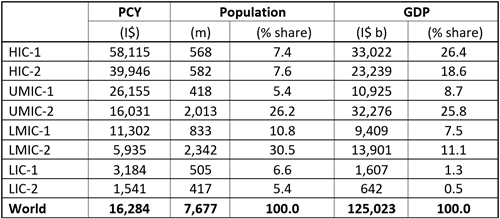
Source. UBSS Energy Consumption Model, which uses data published by Statista,
the US CIA (The World Factbook), and the UN’s Population Division.
Static analysis
Table 6b explores the relationship between PCY and PCEE in 1980, 2000, and 2020. Figure 1 shows the corresponding scatter graphs for these three years. For all years the correlation coefficient (CC) is very high (0.986 – 0.989), and well above the Pearson critical value for the 99% confidence level (0.834).
Table 6b. Statistical relationships between PCY and PCEE, 1980-2020
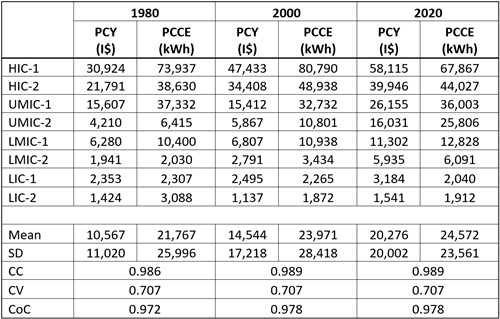
Source. Calculations by the author using data from the UBSS Energy Consumption Model.
Abbreviations. SD – standard deviation, CC – correlation coefficient,
CV99% – critical value for 99% confidence level, CoD – coefficient of determination.
Figure 1. Scatter graphs for PCY and PCEE, 1980-2020
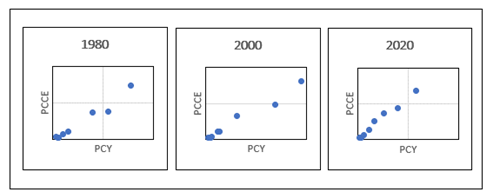
Source. Constructed using data from Table 3b.
The regression equations for the three years are:
1980: PCCE = -2,807 + (2.33 * PCY)
2000: PCCE = 238 + (1.63 * PCY)
2020: PCCE = 948 + (1.17 * PCY)
The regression equations explained 97% of the variation in PCCE in 1980 and 98% in 2000 and 2020. However, the strength of the relationship declined over the period: a rise in PCY of $1 caused PCCE to increase by 2.33 kWh in 1980, but by only 1.63 kWh in 2000 and by 1.17 kWh in 2020.
Dynamic analysis
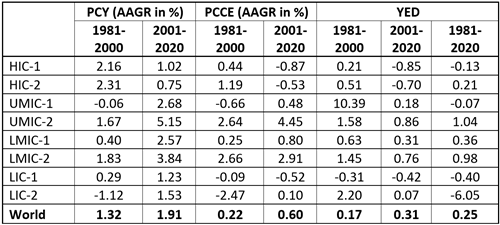
Table 6c shows that the income elasticity of demand (YED) was quite low during 1981-2020, at 0.253 – i.e., the growth of PCCE was only a quarter that of PCY. It was also negative in the highest income group, where, over the four decades, PCY rose by 88% but PCCE fell by 8%. At first glance, this might seem to be inconsistent with the strong cross-sectional relationship between the two variables. However, the efficiency of energy generation increased considerably during the period. For example, much less petrol per kilometre was needed in cars, so a high-income person travelling 20,000 kilometres in 2020 consumed less energy for this activity than their counterpart in 1980. The same phenomenon applied to powering household appliances, airplanes, and ships, and to producing steel and aluminium. For the highest income group over the four decades, and for both HIC groups in the last two decades, the effect of improvements in energy efficiency appears to have been greater than the effect of rising PCY on PCCE. However, for the upper -middle-income groups that contain China and the lower-middle-income groups that include India, where PCY rose much more strongly, the effect of rising incomes was greater than the effect of increasing energy efficiencies.
Table 6c. Statistical relationships between PCY and PCEE, 1980-2020
Source. UBSS Energy Consumption Model, which uses data published by Statista,
the US CIA (The World Factbook), and the UN’s Population Division.
Abbreviation. YED – income elasticity of demand.
CONCLUSIONS
Historically, rising population has been the major factor driving the growth of energy consumption. During 1981-2020, global population increased by 75%, accounting for almost three quarters of the increase in global energy consumption (105%). However, the growth of population peaked in 1969, was less than half its peak rate by 2020, and is expected to approach zero toward the end of this century. Population growth will have a diminishing and eventually zero effect on the global consumption of energy.
However, per capita consumption of energy (PCCE) is strongly correlated with per capita income (PCY), at least up to PCY of about I$ 60,000. The widening process of PCY convergence, which began with the four Asian tigers in the 1960s and 1970s, incorporated China in the 1980s, spread to South Asia around the turn of the millennia, and is now putting down deepening roots in Africa, should drive strong increases in PCY among the middle- and low-income countries during the remainder of this century. Rising PCY will take over from population growth as the driver of increased consumption of energy.
Increases in the efficiency with which energy is used to produce intermediate and final goods and services have been slowing the growth of energy demand. It is difficult to estimate the extent to which these efficiencies can continue to increase, particularly in the high-income countries that operate close to the global technology frontier. However, it is clear that these efficiencies will need to be included in models designed to make projections of future energy demand.
REFERENCES
Hooke, A. (2022). Primary energy markets – Oil. Post-COVID Reflections on Unit Content and Delivery, Assessment, and Student Engagement. Intertype.
Hooke, A. (2022). Primary energy markets – Coal. Post-COVID Reflections on Unit Content and Delivery, Assessment, and Student Engagement. Intertype.
Hooke, A. (2022). Primary energy markets – Gas. Post-COVID Reflections on Unit Content and Delivery, Assessment, and Student Engagement. Intertype.
Hooke, A. (2022). Primary energy markets – Nuclear. Post-COVID Reflections on Unit Content and Delivery, Assessment, and Student Engagement. Intertype.
Hooke, A. (2022). Primary energy markets – Hydro. Post-COVID Reflections on Unit Content and Delivery, Assessment, and Student Engagement. Intertype.
Appendix. Country Groups by PCY in 2020
|
HIC-1
|
HIC-2
|
UMIC-1
|
UMIC-2
|
||||||||||||||||||||||||||||||||||||||||||||||||||||||||||||||||||||||||||||||||
|
LMIC-1
|
LMIC-2
|
LIC-1
|
LIC-2
|
BIOGRAPHY

Angus Hooke is an Emeritus Professor, Senior Scholarship Fellow, and Director of the Centre for Scholarship and Research (CSR) at UBSS. His earlier positions include Division Chief in the IMF, Chief Economist at the NSW Treasury, and Professor and Head of the Business School (3,300 students) at the University of Nottingham, Ningbo, China. Since early 2019, Angus has published 15 refereed articles, authored one book on Economics, and been Chief Editor of seven books (four with Professor Greg Whateley, all for the UBSS CSR).