
ABSTRACT
The deterioration in diplomatic and trade relations between Australia and China during the COVID-19 pandemic led to greater urgency and importance being placed on Australia-India bilateral trade arrangements. It is now likely that the long-discussed trade agreement between the two countries will be enacted in 2023. It is even more likely that, during the coming decades, India will become Australia’s largest export destination.
INTRODUCTION
Historical ties between Australia and India date back to the establishment by Britain of a penal colony in New South Wales in 1788. From the beginning, Britain granted control over all trade to and from the new colony to the British East India Company’s office in Kolkata. Formal diplomatic relations between Australia and India were established in 1941 – six years before India gained independence - when the Consulate General of India opened a Trade Office in Sydney. In 1944, Australia appointed its first High Commissioner to India, and in the following year India’s first High Commissioner to Australia took up his post in Canberra (DFAT, 2022).
The relationship developed very slowly during the following 4-5 decades. On India’s side, the post-Independence government of Jawaharlal Nehru promoted a government-led, inward-looking economic growth strategy, with the Prime Minister famously stating that “To import from abroad is to be slaves of foreign countries” (Panagariya, 2008). His government and succeeding Indian governments placed highly restrictive quantitative restrictions and high tariffs on imports in order to protect domestic firms from more efficient foreign producers. Inward foreign domestic investment (FDI) was also discouraged (Hooke and Alati, 2022). On Australia’s side, attention was focused on East Asia, where trade opportunities exploded in Japan during the 1950s and 1960s, in the four Asian tigers (South Korea, Taiwan, Hong Kong, and Singapore) during the 1960s and 1970s, and in China from the early 1980s.
India’s economic strategy changed dramatically in 1991. This was due to a combination of factors including stagnation of per capita income during the first four decades of Independence; the highly-publicised success of those east-Asian economies that adopted strategies of export- and FDI-led growth; the decline in credibility of the central-planning model following the collapse of the Soviet Union; and the prospect of an imminent and major foreign exchange crisis. The Indian government’s emphasis on socialism was replaced by support for the principles of liberalisation and globalisation, many industries were privatised, import duties were slashed, and a welcoming approach was adopted toward inward FDI. The subsequent economic success of the Indian economy (average annual labour productivity growth during 1991-2000 was 4.3%, more than 2.5 times the global average of 1.7%) encouraged the Indian government to actively pursue trade and investment opportunities, including with Australia. The resurgence of the Indian economy led Australia to place increasing importance on strengthening its economic ties with that country, a trend that was encouraged by the slowing of economic growth in northeast Asia and, in 2021, the imposition by China of restrictions on imports from Australia.
TRADE BETWEEN INDIA AND AUSTRALIA
Table 1. Australia’s top 10 goods export markets 2020-21
(AUD million)
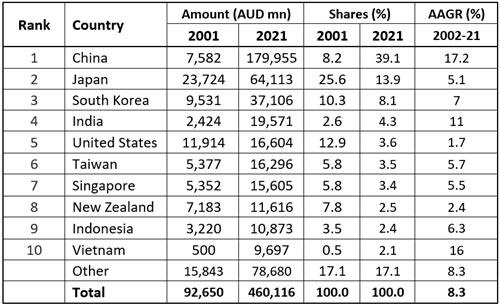
Source: DFAT (2021).
Exports to India grew rapidly during the first two decades of the 21st century. The average annual growth rate (AAGR) was 11.0%, below the corresponding rates for China and Vietnam but well above the rate for Australia’s total exports, of 8.3% (Table 1). It was double the growth rate of exports to Japan, five times the growth rate of exports to New Zealand, and seven times the rate to the United States.
Table 2. Australia’s top 10 bilateral trading partners 2019-20
(AUD billions)
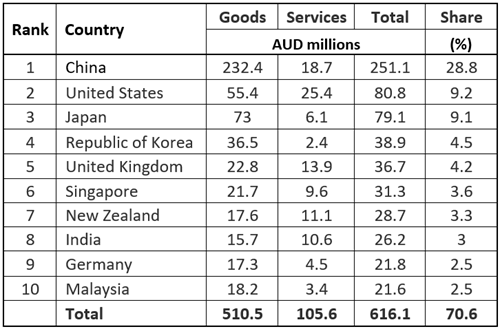
Source: DFAT (2021).
Trade between the two countries continued to grow strongly during the COVID-19 pandemic. Two-way trade rose from US $18 billion in 2020 to US $28 billion in 2021 and was US $20 billion in the eight months to November 2022. Exports from Australia to India accounted for 70% of the bilateral trade. Australia’s main exports were coal, coke, and briquettes (US $10.8 billion during April-November 2022) and gold (US $600 million). Australia’s major imports from India were petroleum products (US $2.5 billion), pharmaceutical products (US $240 million), and precious stones and jewellery (US $250 million). FDI from Australia to India amounted to US $1.1 billion.
However, there is still considerable scope for expansion of trade with India. In 2021, India’s GDP (I$ 9.3 trillion) was third largest in the world, behind only China (I$ 24.9 trillion) and the United States (I$ 21.1 trillion). However, despite the strong growth in the two preceding decades, India’s share of Australia’s exports was only 4.3%. In 2022, India’s population passed that of China, and is projected to be 36% larger by the end of the century. The country has a large, highly motivated, and educated work force that is fluent in English, its economy is complementary with that of Australia, and it is geographically close to Australia. As Gurry (1993) suggested several decades back “India should rank as one of Australia’s most important neighbours” for bilateral trade and economic relationships.
SCENARIOS FOR AUSTRALIA’S FUTURE EXPORTS TO INDIA
We use the following model to develop scenarios of Australia’s exports to the five leading destinations in 2020 – China, Japan, South Korea, India, and the United States:
XCt = SCt * GDPCt (1)
GDPCt = VCt * NCt (2)
NCt = RCt * PCt (3)
Where -
XC is Australia’s exports to the specified country, measured in 2020 US dollars;
SC is the ratio of Australia’s exports to the specified country to the GDP of that country;
VC is labour productivity in the specified country, measured in 2020 US dollars;
NC is the work force in the specified country;
RC is the ratio of the work force to population in the specified country;
PC is population in the specified country;
The subscript, t, refers to the year – 2020, 2060, or 2100; and
The superscript refers to the country receiving Australia’s exports.
Table 3. Population in the specified countries, 1980-2100
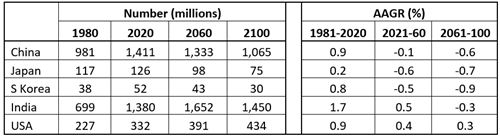
Source. UN Population Division, published in Statista 2023.
Table 3 shows population in the five target countries at 40-year intervals from 1980 to 2100 – the UN Population Division’s estimates of actual population in 1980 and 2020 and its median projections of population for 2060 and 2100. In three of the countries, population declines in both forecast periods. For India, population increases during 2021-2060 and falls during 2061-2100 while for the United States it rises in both periods.
Table 4. Labour force in the specified countries, 1980-2100
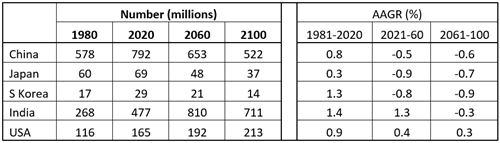
Source. Table 3 and Hooke’s World Income Model (Hooke, 2023).
A country’s labour force is the mathematical product of its population size and population participation rate (PPR –the proportion of the population that is in the work force). The latter depends mainly on birth and death rates and tends to increase as economies mature and population growth declines. In 2020, the global PPR was 0.44; however, it was 0.49 in the high-income countries and only 0.38 in the lower middle-income countries (which include India). In 2020, reflecting the one-child-per-family policy introduced by Deng Xiaoping in 1979, China was enjoying a substantial demographic gift – its PPR was 0.56. India, however, was bearing a sizeable demographic burden; with a high proportion of the population aged 0-14 years and therefore too young to enter the labour force, its PPR was only 0.35. This demographic gap accounted for 34% of the difference in GDP between China and India in 2020. It is expected that the gap will close during the coming decades.
Table 4 suggests that during 2021-2060 the work force will decline by 139 million in China, 20 million in Japan, and eight million in South Korea. However, it will rise by 333 million in India and 27 million in the United States. During the second forecast period, the work force will increase only in the United States. India’s share in the total labour force of the five countries was 25% in 1980 and 31% in 2020. It is projected to increase to 47% by 2060.
Table 5. Labour productivity in the specified countries, 1980-2100
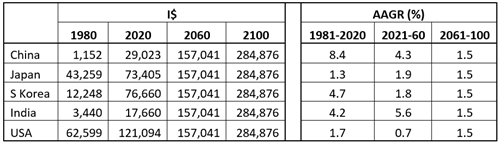
Source. Hooke’s World Income Model (2023).
Table 5 shows estimates of labour productivity in 1980 and 2020 and projections of labour productivity for 2060 and 2100 from the high-growth variant of Hooke’s World Income Model. This variant assumes that the process of labour productivity convergence will be completed by 2050 in the upper-middle-income countries (which include China), by 2060 in the lower-middle-income countries, and by 2080 in the low-income countries. The implied AAGR of labour productivity for India during 2021-60 of 5.6% is slightly higher than the 4.8% achieved in the first two decades of this century. However, it is well below the rates attained by east-Asian economies such as South Korea, Taiwan, Hong Kong, and Singapore when they were in the catch-up phases of labour-productivity convergence (Hooke, 2023).
Table 6. GDP in the specified countries, 1980-2100
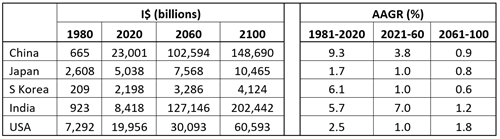
Source. Tables 4 and 5.
Table 6 shows the implications for GDP of the projections for population, PPR, and labour productivity. Reflecting the higher growth of its population, the phasing out of demographic influences on the working-age population, and the completion of labour productivity convergence, India’s GDP is 24% higher than that of China in 2060 and 34% higher in 2100.
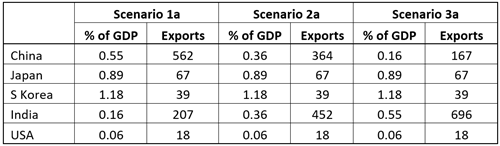
Table 7. Scenarios of Australia’s exports in 2060
(Millions of 2020 $A)
Source. Table 6, Hooke’s World Income Model, and data from
the CIA’s The World Factbook.
Table 7 shows three different scenarios of Australia’s exports to the five target countries in 2060. Scenario 1a assumes that 2020 ratios of imports from Australia to own-GDP prevail in all target countries in 2060. In this case, even though GDP is higher in India, China’s imports from Australia are 2.7 times higher than those of India, due to the much higher ratio of imports from Australia to own-GDP in China.
However, relations with China have deteriorated and those with India are strengthening. Also, Australian companies, now more aware of the uncertainties of the Chinese market and the shift of the growth centre of the world economy from northeast Asia to south Asia, are diversifying their export destinations, especially toward India. This latter trend will be boosted by the implementation of the trade agreement between Australia and India. Scenario 2a shows exports by Australia to these two countries assuming that the export ratios of both converge on their 2020 simple average of 0.36%. In this case, Australia’s exports to India would be 24% greater than its exports to China.
Scenario 3a shows exports to the target countries if 2020 export ratios are still maintained for Japan, South Korea, and the United States but are reversed for China and India. The ratio for India could increase substantially if the rise in population and increase in per capita income lead to a large and sustained expansion of infrastructure and therefore strong growth in demand for Australia’s coal, iron ore, and other minerals. The corresponding ratio for China could also drop significantly if falling population and declining economic growth slow down the expansion of public and private infrastructure. In this case, exports by Australia would be four times higher to India than to China in 2060.
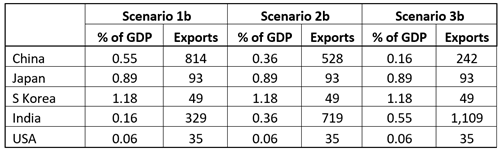
Table 8. Scenarios of Australia’s exports in 2100
(Millions of 2020 $A)
Source. Table 6, Hooke’s World Income Model, and data from
the CIA’s The World Factbook.
Table 8 shows the implications of the export ratios used in Table 7 for real export values in 2100. With GDP being higher in all target countries, Australia’s exports to these countries are also higher. However, due to the slower decline in its work force during 2061-2100, GDP growth is higher in India than in China. In 2100, Australia’s exports to India are 4.6 times higher than its exports to China. They are 12 times higher than exports to Japan, 23 times higher than exports to South Korea, and 31 times higher than exports to the United States.
CONCLUSION
During 2021-60, India’s work force will rise well above that of China and its labour productivity is likely to catch up with that of China. Hence, India’s GDP in 2060 could be significantly larger than that of China. It is also likely that, with political ties strengthening between Australia and India and Australian companies switching focus from northeast Asia where growth rates are declining to south Asia where they are increasing, the ratio of imports from Australia to own-GDP will rise in India and fall in China. If both probabilities are realised, India will be Australia’s largest export market by 2060.
REFERENCES
CECA. (2019). Comprehensive Economic Cooperation Agreement. Retrieved from https://dfat.gov.au/trade/agreements/negotiations/aifta/Pages/australia-india-comprehensive-economic-cooperation-agreement.aspx.
CEIC. (2019). India Foreign Direct Investment: Inflow: Australia. https://www.ceicdata.com/en/india/foreign-direct-investment-inflow-annual-by-country/foreign-direct-investment-inflow-australia.
DFAT. (2021). Market Insights, Retrieved from https://www.dfat.gov.au/IESUpdate.
DFAT. (2022). Trade Statistics. Retrieved from https://www.dfat.gov.au/trade/trade-and-investment-data-information-and-publications/trade-statistics/trade-time-series-data.
DFAT. (2022). An India Economic Strategy. Retrieved from https://www.dfat.gov.au/publications/trade-and-investment/india-economic-strategy/ies/chapter-2.html).
Economic Analysis. 2021. India primed for growth as Australia links deepen. Retrieved from https://www.austrade.gov.au/news/economic-analysis/india-primed-for-growth-as-australia-links-deepen.
Gurry, M. (1993). Leadership and Bilateral Relations: Menzies and Nehru, Australia and India, 1949-1964. Pacific Affairs, 65(4), 510-526.
Hooke, A., and Alati, L. (2022). The world’s largest economies in 2100 – India No. 1. In Post-COVID Reflections on Unit Content and Delivery, Assessment, and Student Engagement ed by A. Hooke and G Whateley.
Hooke, A (2023). The global demand for energy, 2021-2100. UBSS Publications Series. https://www.ubss.edu.au/articles/2023/march/the-global-demand-for-energy-1980-2020.
India Briefing. (2022). India-Australia Trade and Investment Trends and Prospects. Retrieved from https://www.india-briefing.com/news/trade-and-investment-between-india-and-australia-trends-and-prospects-23491.html.
Market Insights (2021). India Market Insights 2021 - Department of Foreign Affairs and …
https://www.dfat.gov.au/sites/default/files/india-market-insights-2021.pdf.
Media release (2022). Investing in the Australia-India relationship. Retrieved from https://www.trademinister.gov.au/minister/dan-tehan/media-release/investing-australia-india-relationship.
Menon, J. (2009). Dealing with the Proliferation of Bilateral Free Trade Agreements. The World Economy, 1381-1407.
The World Bank: World Development Indicators, Retrieved from http://wdi.worldbank.org/table/4.8.
Varghese, P. N. (2018). Indian Economic Strategy 2035. Retrieved from https://dfat.gov.au/geo/india/ies/index.html.
WITS: World Integrated Trade Solution,2020. Retrieved from https://wits.worldbank.org/CountrySnapshot/en/IND.
BIOGRAPHIES

Angus Hooke is Emeritus Professor, Senior Scholarship Fellow, and Director of the Centre for Scholarship and Research (CSR) at UBSS. His earlier positions include Division Chief in the IMF, Chief Economist at BAE (now ABARE), Chief Economist at the NSW Treasury, Professor of Economics at Johns Hopkins University, and Head of the Business School (3,300 students) at the University of Nottingham, Ningbo, China. Angus has published 14 books and numerous refereed articles in prestigious academic journals.

Harpreet Kaur has a Master of Philosophy and a PhD in Economics. She teaches Economics, Statistics, Governance and Business Ethics at Charles Sturt University, Central Queensland University, and the Australian Institute of Higher Education. Her research interests commenced with development dynamics, socio-economic conditions, and the role of women in India and now include economic relationships between Asia, Oceania, and the rest of the world.