
ABSTRACT
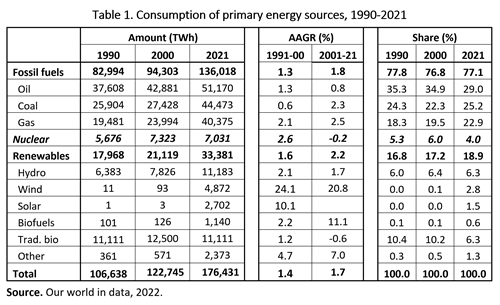
In 2021, nuclear was the world’s second largest source of clean energy (4% of all energy), well behind hydro (6.3%) but also well ahead of wind (2.8%) and solar (1.5%). This article, the fourth in a series of nine articles on the world’s primary energy resources, reviews the history of the nuclear energy industry and illustrates how a multi-criteria decision-making framework and a weighted sum methodology can be used to analyse the contribution of the industry to the global energy mix. The analysis suggests that nuclear fission is a secure, reliable, and safe source of energy. When pecuniary, social, and system costs over the whole production/life cycle are considered, nuclear is cost competitive with fossil fuels and intermittent renewables.
INTRODUCTION
Nuclear energy is produced mainly from uranium, a silver-grey and slightly radioactive metal that exists in minute quantities in most rocks and soils as well as in rivers and oceans. The existing deposits are believed to have been formed from supernovae that occurred about 6.5 billion years ago – 2 billion years before Earth was formed. These deposits are the main source of heat inside the Earth and are a major contributor to the convection currents that drive the planet’s tectonic plates (US Office of Nuclear Energy, 2022).
Uranium, symbolised by U, is the Earth’s heaviest naturally-occurring element. It has an atomic number of 92, meaning that its nucleus contains 92 protons. There are three naturally occurring uranium isotopes (same number of protons but different numbers of neutrons), with atomic weights of 238, 235, and 234. Natural uranium ore contains all three isotypes, and has a highly stable average composition of 99.2742% for U-238, 0.7204% for U-235, and 0.0054% for U-234.
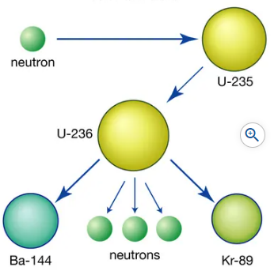
U-235 is the only uranium isotype that is fissile – i.e., under certain conditions, it can be split. When the nucleus of a U-235 isotype captures a free neutron (temporarily producing a U-236 isotype), the nucleus vibrates, causing the atom to fission into two smaller atoms. The fission process releases several neutrons. If the uranium mix is rich enough, the newly released neutrons – when moving sufficiently slowly - are captured by other U-235 isotypes, causing further fission and a chain reaction. The fission process also releases huge amounts of energy - the fission of one U-235 nucleus releases about 50 million times more energy than is generated when one carbon atom combines with oxygen atoms during the burning of coal (US Office of Nuclear Energy, 2022).
THE NUCLEAR FUEL CYCLE
The nuclear fuel cycle has front-end and back-end activities. The front-end activities consist of the mining, milling, conversion. and enrichment of uranium as well as the fabrication of nuclear fuel and the generation of electricity. The back-end activities comprise temporary storage, reprocessing, recycling or disposal of spent fuel, and disposal of wastes.
Front-end activities
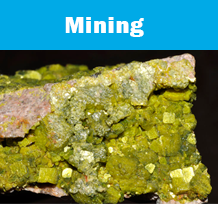
Mining
In 2020, more than 50% of the world’s uranium was produced from 10 mines in five countries (Kazakhstan, Australia, Namibia, Uzbekistan, and Canada). Historically, uranium was extracted from conventional surface and underground mines. However, increasingly mining companies are using an in-situ leach (ISL) method, which avoids any major ground disturbance. This method involves circulating oxygenated groundwater through a porous uranium orebody. The water absorbs the uranium, which is a soluble element, before being pumped to a surface treatment plant where the uranium is recovered as precipitate. Most of the mines in Kazakhstan, Australia, and the USA use the environmentally-friendly ISL method.
Milling
In the mills, which are normally adjacent to the mines, ore from conventional mines is crushed and ground to a fine slurry. It is then leached with sulphuric acid to separate the uranium from the waste rock. Then, as with ISL leachate, the solution is filtered and dried to produce uranium oxide concentrate, generally referred to as ‘yellowcake’. About 200 tonnes of uranium oxide concentrate can fuel a large (1,000 megawatts) nuclear power reactor for a year.

Conversion
U-235, the fissile uranium isotype, makes up only 0.7% of natural uranium. For fission to occur easily, the share of U-235 in the uranium mix must be increased to 3.5-5%. This requires that the uranium be in gaseous form. The conversion is achieved by refining the uranium oxide concentrate into uranium dioxide, which is then transformed into the gas, uranium hexafluoride. The latter is drained into cylinders where it solidifies before being shipped to an enrichment plant.

Enrichment
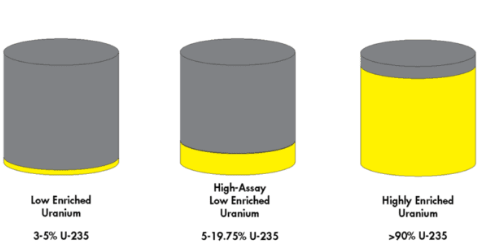
The enrichment process involves feeding the uranium hexafluoride into centrifuges that separate most of the fissile U-235 isotype from the slightly heavier but much more abundant and non-fissile U-238 isotype. This results in two outputs, one of low-enriched uranium and the other of depleted uranium. The low-enriched uranium contains enough U-235 (3-5%) to meet the requirement of nuclear power reactors. The maximum legally permissible U-235 content for civilian purposes is 19.5% (high-assay, low-enriched uranium), which is well below the 90+% (highly enriched uranium) required for an atomic bomb.
Fuel fabrication
Fuel fabrication entails transforming the low-enriched uranium into uranium dioxide powder, and then pressing and heating the powder to form small ceramic fuel pellets. The pellets are encased in metal tubes to make fuel rods. The rods are organised into assemblies that can be placed inside nuclear reactors. A set of assemblies containing about 27 tonnes of enriched uranium is sufficient to keep a 1,000-megawatt plant generating electricity for a year.

Electricity generation
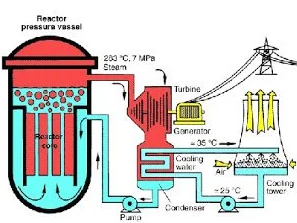
Like fossil-fuel power stations, nuclear power stations use heat energy. In fossil-fuel plants the heat is produced by burning oil, coal, or gas while in nuclear plants it is caused by fissioning uranium nuclei. The assemblies of fuel rods containing the enriched uranium pellets are placed inside a reactor, along with neutron-absorbing rods that can be inserted or withdrawn to adjust the reactor’s power output whatever level is required. The fuel elements are surrounded by a moderator, such as water or graphite, that lowers the speed of the emitted neutrons. Some of the U-238 isotope in the reactor core is turned into plutonium and about half of this is also fissioned. The process is fully controlled. A major uncorrected malfunction in a reactor can lead to overheating and melting of the nuclear fuel. However, because of the way in which the fuel is designed and the low share of U-235 in the fuel mix, it cannot give rise to an atomic explosion (Ulmer-Scholle, 2022).

The succeeding processes in the generation and distribution of electricity are the same for nuclear as for fossil-fuel plants. The heat makes steam that spins a turbine. The latter drives a generator and produces electricity. The electricity is transmitted to storage sub-stations in different locations before being distributed to final users. The commonality of later-stage activities between nuclear and fossil-fuel plants of equal capacity both allows retired fossil-fuel plants to be converted to nuclear plants and avoids the need for additional transmission and distribution lines. A typical 1,000-megawatt nuclear power plant provides 8 terawatt hours (8 TWh) of electricity a year, enough to meet the needs of about one million people.
Back-end activities
Temporary storage
After continuous operation for 18-36 months, the low-enriched uranium in the plant’s assemblies is depleted to a level where it becomes economical to replace about one-third of the spent fuel with fresh fuel. The used fuel, which is still highly reactive, is removed from the reactor and placed immediately in a storage pond. The water in the pond shields the radiation and absorbs the heat. Over time, the radiation level decreases and, after several years, the used fuel is transferred to dry storage, where the radioactivity continues to decline.
Reprocessing
The used fuel includes 96% uranium and 1% plutonium. Only 3% is waste products. It is often cost-effective to reprocess the used fuel by cutting up the fuel rods and dissolving them in acid to separate the various materials. The uranium and plutonium can then be recycled as fresh fuel while the vastly reduced waste products, which are still highly radioactive, can be stored, first in liquid form and subsequently as solids.
Recycling
The uranium recovered from reprocessing must be converted and enriched before it can be recycled as fuel. The plutonium can be directly made into mixed oxide (MOX) fuel, where it substitutes for U-235 in normal uranium oxide fuel. About eight reprocessed fuel assemblies can yield one MOX fuel assembly, eliminating the need to purchase about 12 tonnes of natural uranium from a mine.
Apart from its incidental transformation into plutonium in a normal reactor, U-238 is not usable in most reactors. However, in a fast neutron reactor it is fissionable and (more importantly) gives rise to plutonium. It is therefore potentially valuable. Increasingly, used fuel is regarded as a future resource rather than a waste.
Storage
Waste from the nuclear fuel cycle comprises low-level waste that is produced during all stages of the cycle and high-level waste that contains highly-radioactive fission products. Liquid high-level waste can be calcined (heated strongly) to produce a dry powder, which is incorporated into borosilicate (Pyrex) glass and immobilized. A year's waste from a 1,000-megawatt reactor can be contained in five tonnes of such glass. The liquid glass is poured into stainless steel canisters that, with appropriate shielding, can be easily transported and stored.
Disposal
Low-level waste, which accounts for about 90% of all nuclear waste, can be disposed of almost anywhere. Typically, it is sent to land-based waste-management facilities.
Currently, there are no disposal facilities (as opposed to storage facilities) for high-level waste. This is because the total volume of such waste is still relatively small, its radioactivity progressively decreases in storage making the waste easier to handle, and the stored waste may have economic value if the demand for nuclear energy increases strongly and/or the costs of reprocessing spent fuel decreases. However, many countries are developing options for the disposal of used fuel and waste from reprocessing. There seems to be an emerging consensus favouring its placement in suitable and remote geological repositories, about 500 metres deep (US Energy Information Administration, 2022).
HISTORY
The history of atomic energy can be divided into four phases: understanding the science in Europe (1789-1939); developing the technology and the industry in the Soviet Union, the United Kingdom, and the United States (1946-80); a levelling off in demand and strong activism against nuclear power after accidents occurred in nuclear plants in the USA and Russia (1980-2005); and a strong revival of global demand and increasing acceptance of nuclear power, led by Asia (from about 2006).
Uranium oxide was discovered In 1789 by Martin Klaproth, a German chemist, after he added potassium salts to a precipitate of zinc, iron, and nitric acid. The resulting chemical reaction was not what Klaproth had expected, and he concluded that a new element must be involved. He named this element Uranus, after the planet that had been discovered eight years earlier. In 1841, Eugène-Melchior Péligot, a French chemist, isolated pure uranium by heating uranium tetrachloride with potassium. Subsequent developments included the discovery that some elements are radioactive (Henri Becquerel in 1896), that radioactivity as a natural process can lead to the creation of different elements (Ernest Rutherford in 1902), that atomic transformation can be achieved artificially by bombarding uranium nuclei with accelerated protons (Cockcroft and Walton in 1932), that neutrons are more effective at producing atomic transformation than protons (Enrico Fermi in 1935), that the energy released by the fission process is huge – about 200 million electron volts (Lise Meitner and Otto Frisch in 1938), that fission releases additional neutrons that can cause fission in other uranium nuclei, leading to a self-sustaining chain reaction (Hahn and Strassmann in 1939), and that fission occurs more frequently with slower-moving neutrons (Niels Bohr in 1939) (World Nuclear Association, 2022).
With the commencement of World War II in 1939, the attention of nuclear scientists in Europe became concentrated on the development of an atomic bomb. In the USA, which was not yet a participant in the War, emphasis was directed to the use of uranium for naval propulsion and electric power. However, after Japan attacked Pearl Harbour on 7th December 1941, the Americans also focused exclusively on the potential of nuclear energy to serve military purposes.
Following the end of World War II, American and European nuclear scientists and government officials transferred their attention from the ‘bomb’ to the ‘boiler’. The technologies that had been developed during the War facilitated efforts to use nuclear energy both directly in industry and households and to generate electricity. In the USA, the first nuclear reactor to produce electricity commenced operations in 1951. The first fully commercial reactor (250 megawatts), which was designed by Westinghouse, commenced operation in 1960. The first nuclear-powered submarine, USS Nautilus, was launched in 1954 and the first nuclear-powered surface vessels were completed in 1959. By the end of the 1960s, orders were being placed for reactor units of more than 1,000 megawatts.
Other countries, including the Soviet Union, the United Kingdom, France, and Canada were also actively involved in the early development of nuclear energy for peaceful purposes. The Soviet Union built the first nuclear plant that produced commercial amounts of electricity. This plant was located in Obninsk and commenced operation in 1954. In France, commercial production began in 1959. France then adopted a standardised design, a practice that has continued and has been highly cost effective. Canada adopted a different approach, choosing to use natural - rather than enriched - uranium fuel with heavy water as both a moderator and a coolant. Its first plant commenced operation in 1954.
The generation of electricity from nuclear fission increased rapidly from the middle 1960s. The industry’s share of global energy production, which was only 0.4% in 1970, rose to 2.3% in 1980, 5.3% in 1990, and 6.0% in 2000. However, the strong increase in production during 1980-2000 was due to the completion of plants that had been approved during the 1960s and 1970s and to increases in the efficiency of existing plants. Very few new plants were approved in western countries after 1980. This was due to accidents at two nuclear power plants. The first was in 1979, at Three Mile Island in Pennsylvania, USA. It was caused by the failure of a relief valve, which resulted in severe damage to the reactor’s core. The accident did not cause any injuries or deaths and there were no discernible health effects on plant workers or the general public. The second accident was in 1986, at Chernobyl in the Ukraine. The cause was a steam explosion that destroyed a reactor and led to fires that spread 50 tons of radioactive waste across much of Western Europe. About 30 people died from acute radiation poisoning. According to the World Nuclear Association, the accident was “… the product of a flawed Soviet reactor design coupled with serious mistakes made by the plant operators.” (Process Industry Forum, 2022).
A further setback occurred in 2011, at the nuclear power plant in Fukushima, Japan, when an earthquake measuring 9.0 on the Richter scale produced a 15-metre tsunami that cut off plant access to external energy supplies and disabled backup diesel generators. This led to a crippling of the reactor’s cooling systems and the melting of fuel in three of the reactor cores. The radiation released from the damaged reactors contaminated a wide area surrounding the plant, forcing the evacuation of nearly half a million residents. Six workers received radiation doses that were above the level set by Japan’s Nuclear and Industrial Safety Agency (NISA) but were below the levels that would cause radiation sickness. About 1,000 deaths occurred as a result of the evacuation process (Union of Concerned Scientists, 2013).
Since the mid-2000s, there has been a revival in the prospects for the nuclear industry. This has been due to four factors. First, strong economic growth in Asia and Africa, which have high income-elasticities of demand for both industrial and domestic energy, has caused the consumption of energy to grow strongly. Second, shifts in geopolitical power have underscored the importance of energy security, especially of energy that can reliably meet demand at all times. Third, increasing concerns about climate change have strengthened support for energies that have low carbon emissions. Fourth, a new generation of nuclear reactors that have more safety features and can provide more energy at lower prices than their predecessors has emerged.
In mid-2022, the world had about 440 nuclear reactors. The USA had the largest number (92), followed by France (56), China (54), Russia (37), and Japan (33). In the wake of the Fukushima disaster, Japan closed its nuclear plants. However, it has since brought 10 plants back on line and a further 15 plants are seeking restart approval. Globally, 55 more reactors, with capacity, equivalent to approximately 15% of existing capacity, were under construction. China was building the most plants (21), followed by India (8), and South Korea (3). Four countries - Bangladesh, Belarus, Turkey, and the United Arab Emirates - were constructing their first nuclear power plants.
The biggest increase in the number of proposed plants has been in Asia, particularly China and India. In 2021, the Chinese government announced that it intended to build 150 new reactors, which is more than the entire world built during the preceding 35 years (Van der Merwe, 2022). In 2022, India announced plans to commence construction of 10 new nuclear reactors within the following three years (India Times, 2022).
Globally, the industry is now thriving, but the leading drivers have moved from Europe and North America to Asia (World Nuclear Association, 2022).
ANALYSIS OF NUCLEAR AS AN ENERGY SOURCE
Approach
In this section, I describe how a Multi-Criteria Decision-Making (MCDM) framework and a Weighted Sum (WS) method of processing numerical estimates can be used to analyse the relative contributions of a range of energy resources to the global energy mix. The approach can be applied to different scenarios such as a constant shares scenario or any of the three scenarios developed by the International Energy Agency (IEA) in its World Energy Outlook reports (IEA, 2022). In this article, I use the framework to consider primary energy from three sources – fossil fuels, nuclear fission, and intermittent renewables. Where data are available only for components of these sources, such as coal and gas separately or wind and sun separately, I obtain a single value by weighting the component contributions using their shares in the global primary energy supply in 2021.
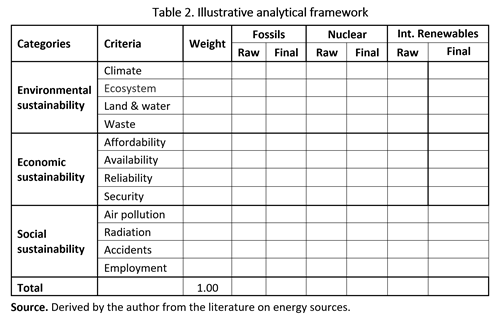
The list of criteria shown in Table 2 below has been derived from the literature on energy, particularly the UN’s sustainability reports, but also the sections of articles, books, and video clips devoted to discussions of the advantages and disadvantages of specific energy resources. Conveniently, there is a high degree of overlap in the lists. For this article, the criteria have been grouped into the three widely used primary categories of environmental, economic, and social sustainability. Environmental sustainability criteria focus on climate, the ecosystem, land & water resources, and waste. Economic sustainability criteria comprise the affordability, availability, reliability, and security of the energy resources. Social sustainability criteria relate to air pollution, employment, radiation, and accidents.
To obtain data for weights and energy resource contributions (Steps 2 and 3), I propose holding a series of seminars attended by interested stakeholders and obtaining their estimates during the seminars. For weights, a benchmark criterion (e.g., climate change) might be selected, a brief discussion held to ensure a common understanding of its meaning and relevance in the particular context, and an arbitrary number assigned to it (e.g., 10). Then, for each of the other criteria, and again following a brief discussion of meaning and relevance, a score relative to the benchmark number would be assigned by each participant. The contributed weights would then be expressed as a fraction (or a percentage) and averaged across all participants. A similar approach would be taken to obtain raw data for the contribution of each energy resource against each criterion, with a range of 10 (for the best resource) to 6 (for the worst resource) applying to each criterion.
During the three decades ending 2020, the average annual growth rate (AAGR) of global energy consumption was 1.5%. Population growth contributed 1.3 percentage points (pp) and per capita consumption growth the remaining 0.2pp. During the three decades to 2050, the AAGR of population is projected by the UN’s Population Division to fall to 0.7%. However, it is likely that the AAGR of per capita energy consumption will rise during this period. In 2020, the world’s poorest 4 billion people (more than 50% of the global population) used only 5% of the amount of energy consumed by those living in the richest countries. If, during 2021-50, per capita consumption of energy were to be unchanged in the higher-income countries and the only one third of the gap with the poorest 4 billion were to be closed, the AAGR of total per capita consumption of energy during 2021-50 would be 0.8%. I adopt this growth rate as a working assumption. It implies continuation of an AAGR for total energy consumption of 1.5%, with the demand for primary energy rising from 168,000 terawatts per hour (TWh) in 2020 to 263,000 TWh in 2050 (A TWh of energy can support the electricity needs of about 150,000 people for a year).
The share of nuclear in total primary energy declined from 5.3% in 1990 to 4.0% in 2020. From the viewpoint of our environmental, economic, and social criteria, what role should nuclear energy play in the global energy mix over the next 30 years? To add precision to our analysis, I specify for the period 2021-50:
- A base scenario in which the share of nuclear energy in the total primary energy mix continues to decline at its 1991-2020 rate, to 3.0% in 2050. In this scenario, the annual production of nuclear energy would still increase - by 1,200 TWh, to 7,960 TWh in 2050.
- An alternative scenario in which the share of nuclear energy is maintained at its 2020 level of 4%. Under this scenario, the annual production of nuclear energy would increase by 3,800 TWh, to 10,600 TWh in 2050. For this alternative scenario, we assume that the differentially higher level of nuclear energy production (NEP = 2,600 TWh) is matched by differentially lower levels of fossil fuel energy production (FFEP) and intermittent energy production (IEP) of 1,300 TWh each (i.e., FFEP = IEP = -1,300 TWh). This approach allows us to compare nuclear energy directly and quantitatively with both fossil fuel energy and intermittent renewable energy.
Environmental sustainability
Climate
The United Nations asserts that climate change is "the defining issue of our time". Under the Paris Agreement, which was signed in 2015, countries aim to keep the rise in the average global temperature, compared to the pre-industrial level, to below 2°C (but preferably to 1.5°C). The plan for doing this requires reducing global emissions of carbon dioxide by 50% by 2030 and achieving net zero emissions by 2050. These targets are ambitious. Global emissions of carbon dioxide from the energy sector, which amounted to 24 billion tons in 2000, have continued to rise since the Agreement was signed, and reached a record 36 billion tons in 2021 (United Nations, 2022). To facilitate achievement of the UN targets, governments are providing considerable support to the intermittent renewable energy industries. However, the energy produced by fossil fuels in 2021, of 136 thousand terawatt hours, was the highest ever, and accounted for 77.1% of all primary energy compared to only 4.3% for wind and solar combined (Table 1).
Unlike energy from fossil-fuel powered power plants, that from nuclear power plants as well as from hydro, wind, and solar do not emit any greenhouse gases during operation. However, the mining and refining of uranium ore and the fabricating of nuclear fuel require energy, as do the production and fabrication of the concrete, steel, aluminium, and other materials needed to construct a nuclear power plant. Over its life-cycle, the generation of energy from nuclear resources produces about 12 grams of carbon dioxide equivalent per kilowatt/hour. However, according to the World Nuclear Association (2022), when the whole fuel cycle is included, this is the same amount as for wind energy, and one-third of the emissions from generating solar energy. Increasing the share of nuclear energy in the primary energy mix (by moving from the Base Scenario to the Alternative Scenario) should therefore reduce carbon emissions by lowering the shares of both fossil fuels and solar.
Ecosystems
Power generation affects ecosystems mainly through the processes of eutrophication (excessive enrichment of a body of water) and acidification. These two processes damage water quality, which harms shellfish and coral and causes excessive growth of algae. Fossil fuels are major sources of both processes at all stages of their fuel cycle. Nuclear power has among the lowest adverse effects of all energy generation technologies on both eutrophication and acidification (World Nuclear Association, 2022).
However, nuclear energy’s reputation may be less satisfactory in relation to impact on bird life. Sovacool (2009) compared North American bird mortality due to fossil fuel, wind, and solar energy generation. He found that, per gigawatt hour, wind energy was responsible for 0.3 fatalities, compared to 0.6 for nuclear energy and 9.4 for fossil-fuel energy. The fatalities from nuclear energy were attributed to habitat degradation from contamination of land and water as a result of mining for uranium and collisions with infrastructure such as cooling towers. Most of the fatalities from fossil fuel energy were due to climate change.
Land and water use
The energy generation sector competes with the agricultural, industrial, and housing sectors as well as with animal and plant life for land and water resources. Nuclear power uses very little land. The in-situ method of mining involves the drilling of small holes that are filled in and restored once the ore has been extracted. Nuclear power plants require 42 hectares to generate a TWh of electricity. A solar farm needs about 30 times as much (1,295 hectares) and a wind farm requires 170 times more (7,200 hectares) (Antonini, 2022).
Nuclear power generation requires a large amount of water for cooling. However, because the energy density of uranium fuel is very high (for example, it is 15,000 times denser than coal), nuclear plants can be located near places where water is abundant – e.g., adjacent to oceans, where they can use once-through sea water cooling.
Waste
Over their whole production/life cycles, all forms of energy generate waste. Wind and solar, which do not use produced fuel, do not generate fuel waste. However, windmill blades, which can be the length of a football field and are built hard enough to withstand hurricanes, must be disposed of when they are retired. They are expensive to breakdown, transport, and reprocess and mostly finish up as landfill (Martin, 2020). Solar panels are harder to dispose of because they contain pollutants such as lead and carcinogenic cadmium. For nuclear, the main problem is the highly radio-active waste that is produced during power generation. However, both the volume of this waste and the number of plants producing it are very small, making it easier to handle safely and dispose of securely.
Economic sustainability
Affordability
The cost of providing energy from a resource can be measured as the sum of levelized costs, system costs, and social costs.
Levelized cost of electricity
The levelized cost of electricity (LCOE) is the price that the electricity must fetch for the providers to break even financially. It measures the total cost to build and operate a power plant over its lifetime divided by the total electricity produced by the plant over that period. It is commonly divided into current costs and capital costs.
Current costs, which account for about 40% of the LCOE for nuclear energy, comprise mainly the costs of fuel and of operation and maintenance (O&M). Unlike the situation with fossil fuels, published fuel cost figures for nuclear must include management of used fuel as well as the storage and disposal of waste products. Typically, fuel costs amount to about one-third and O&M for the remaining two thirds of current costs. In the OECD countries, the total fuel costs of a nuclear power plant are typically 30-50% of those of a coal-fired plant and 20-25% of the costs of a gas combined-cycle plant. For intermittent renewables, fuel costs are zero.
Capital costs comprise overnight costs (i.e., capital costs excluding financing costs during the construction period) and financing costs. Typically, around 80% of capital costs are overnight costs, of which approximately 80% are for engineering, procurement, and construction (EPC). The remaining overnight costs are mainly for contingencies, testing systems, and training staff. Financing costs measure the opportunity cost of the resources used during the construction period (the duration between the pouring of the first 'nuclear concrete' and grid connection). Historically, the construction period has been about five years for a 1,000-megawatt nuclear plant, compared with two years for a natural gas-fired plant. However, in the USA, the planned construction time for a nuclear plant has extended to about 10 years. This has been due mainly to well-organised and sustained opposition from anti-nuclear activists. As a result, the Nuclear Regulatory Commission (NRC) now regulates “the most minute aspects of construction” (Antonini, 2022). It “has a 32-step construction licensing process, and many of those steps require approval from other regulatory agencies that impose their own multi-step approval processes.”. Further, while the NRC is required by law to create an Environmental Impact Statement (EIS) within two years, it “actually takes an average of four years, sometimes as long as six, to write the EIS” (Zubrin, 2022). Estimates of the LCOE for nuclear energy are often based on current estimates of construction time in the USA. However, in Canada, South Korea, and the UK, construction time has remained at 3-5 years and in South Korea the time is shortening.
Social costs
Social costs refer to the value of those negative effects of an activity that are not borne by the provider. For energy, they relate mainly to environment and health. For the environment, the chief concern is carbon dioxide emissions while for health it is air pollution and accidents. The 2020 edition of the OECD study on Projected Costs of Generating Electricity estimated the environmental cost of adding one ton of carbon dioxide to the atmosphere at $30.
The formula for measuring the out-of-pocket LCOE for the provider can be modified to include imputed social costs. An OECD study estimated the LCOE for nuclear energy, including social costs, at 9.9c/KWh. This was below the costs for coal (12.3c/KWh), offshore wind (14,6c/KWh), and solar thermal (18.4c/KWh). However, it was above the cost for natural gas (8.3c/KWh), offshore wind (5.2c/KWh), and solar PV (6.7c/KWh).
System costs
System costs for energy refer to the effects of increasing the supply of energy from a particular resource on the costs of the energy system as a whole. They comprise mainly costs incurred in providing backup to cover downtime associated with refuelling and maintenance, in providing backup generation for intermittent wind and solar plants at times when they are unable to operate, and making additions to the grid so that electricity can be transmitted from where it is made to where it is used. Unfortunately, they “are seldom factored into comparisons of different supply options, especially comparing base-load with dispersed intermittent renewables such as solar and wind” (Economics of Nuclear Power, 2022).
For nuclear energy, as well as energy form coal and gas, system costs are low. Nuclear plants need refuelling only once every 18-36 months, their operation is reliable, and they can normally be integrated easily into the existing grid system. This contrasts with intermittent renewables, which are dependent on unpredictable weather conditions (and so need considerable backup) and are physically dispersed and distant from sources of demand (and so require considerable expansions of the grid system).
The Institute for Energy Research estimated that, when system costs are included, the LCOE of a megawatt-hour of electricity was $41 for coal, $36 for gas, $33 for nuclear, $90 for new wind resources, and $89 for new PV solar resources (Antonini, 2022). Weighting these costs by the share of the industries in our three primary categories, the cost of a megawatt-hour of electricity from fossil fuels was $39, from nuclear was $33, and from intermittent renewables was $90.
Resource availability
Resource availability is a long-term concept. It is often used in the context of sustainability, which includes protecting the future availability of finite resources. Renewables are attractive in part because they do not directly consume resources during the production stage of their fuel-generation cycle. In contrast with the generation of energy from fossil fuels, which depletes reserves of oil, coal, and natural gas, and with energy from nuclear fission, which reduces reserves of uranium, the three major sources of renewables (hydro, wind, and solar) do not, during their production phase, reduce the amount of water, wind, and sun available to future generations.
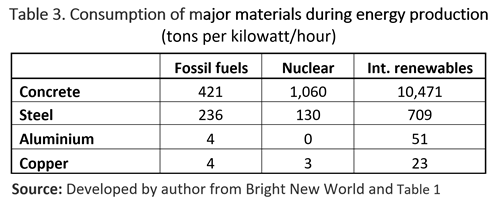
However, during other stages of the energy generation cycle – especially the construction stage - all energy technologies consume non-fuel (as well as fuel) resources, especially concrete and metals such as aluminium, copper, and iron ore used in the production of steel. Table 3 shows the amounts of key non-fuel resources required over the whole production/life cycle to generate one kilowatt/hour of electricity. Nuclear uses 1.5 times as much concrete as do fossil fuels, but only 55% as much steel, 8% as much aluminium, and 60% as much copper. Compared to the intermittent renewables, it uses only 10% as much concrete, 18% as much steel, 1% as much aluminium, and 23% as much copper.
Further, reserves of uranium are being consumed at a very low rate. At the current level of consumption, known reserves are sufficient to generate electricity for 230 years. With new technologies already being considered, this could be extended to 30,000 years (Fetter, 2022). Well before then, we should have access to uranium resources in other parts of the inner solar system. Considering fuel and non-fuel resources, nuclear scores highly in terms of sustainability.
Resource reliability
Nuclear is the most reliable source for generating electricity. In 2021, in the USA, nuclear power plants operated at full capacity more than 92% of the time. Its capacity utilisation rate was almost twice those of natural gas (54%) and coal (49%) plants, and about three times the rates of wind (34%) and solar (25%) plants. Nuclear power plants require little maintenance and can operate for 1.5 to 2 years before needing to be refuelled, and are designed to run 24 hours a day, 7 days a week, and 12 months a year.
Resource security
The oil supply and price shocks of the mid-1970s and early 1980s heightened awareness among policy makers of the importance of supply and price stability for maintaining sustainable growth of economic activity. France responded to the shocks by embarking on a program to substitute nuclear power for imported fossil fuels in the generation of its electricity and Japan replaced a significant proportion of its coal and gas energy with nuclear power. In 2022. the Russian invasion of the Ukraine and political disruptions to supply chains in east Asia reinforced the importance of energy security. The countries that are most vulnerable are those that rely on a narrow range of energy resources, on imports for a significant part of these resources, and on imports from countries with which they are not closely aligned politically.
Financial investment theory tells us that, if the range of uncorrelated assets in a portfolio is narrow, widening it by adding one more uncorrelated asset can reduce considerably the volatility of the portfolio. The physical supply characteristics of the major energy sources are largely uncorrelated; hence, widening the range reduces volatility. Internationally-traded oil and gas come from relatively few countries, several of which are politically unstable, and some of the fuel is transported through pipelines that cross countries with varying degrees of political stability and uncertain political alliances. Coal supplies are more diverse geographically and more reliable. The major resource security concern for renewables is that wind towers, wind blades, and solar panels are made in a small number of countries that sometimes have strained relationships with Western countries.
Uranium is sourced from a wide range of countries geographically and politically. Its high energy density makes it is easy to transport and to maintain a stockpile that can meet energy needs for several years. For example, fuelling a 1,000 MWe power plant for three years requires only about 200 tonnes of natural uranium, or less than 30 tonnes of fabricated fuel. Increasing the share of nuclear in the energy mix should increase energy security for most countries.
Social sustainability
The production/life cycles of all energies affect the health of workers and/or the public, due mainly to their impacts on air quality, to the radiation they emit, and to the accidents they cause. According to Ritchie (2020), deaths per terawatt hour of energy produced are 25 for coal, 18 for oil, 5 for biomass. 3 for gas, 1.3 for hydro, 0.04 for wind, 0.003 for nuclear, and 0.02 for solar. Substituting nuclear for fossils would substantially reduce deaths and using it to replace intermittent renewables would leave the number deaths roughly unchanged. The sourcing of fuel and other materials, and the construction and operation of plants and farms, are also source of income for workers and suppliers, which can be crucial to the development and sustainability of some towns and cities.
Air pollution
According to the World Health Organisation (WHO), about 7 million people die prematurely each year as a result of air pollution. Fossil fuel power plants produce large amounts of air pollution. Nuclear power plants emit virtually none. NASA’s Goddard Institute for Space Studies and Columbia University’s Earth Institute estimated that the use of nuclear power prevented over 1.8 million air pollution-related deaths between 1971 and 2009.
Radiation
Radiation is the emission or transmission of energy in the form of waves or particles through space or a material medium (Wikipedia, 2022). Residents of OECD countries receive an average of 2.4 millisieverts of radiation per year (mSv/yr), 80% of which is from natural sources (e.g., cosmic rays from outer space). The allowed limit for workers in the nuclear industry is 20 mSv/yr. Millions of workers in the industry have been monitored for more than 50 years and their rates of cancer mortality are similar to those of the general public. In the Indian states of Kerala and Madrid, about 140,000 people receive an average of 15 mSv/yr and in parts of Brazil and Sudan the average is about 40 mSv/yr. There is no evidence that these regions have a higher incidence of cancer or other illnesses (World Nuclear Association, 2022).
Only the nuclear industry systematically measures radioactive emissions. However, it is not the only energy-producing industry that exposes its workers to background radiation. According to United Nations Scientific Committee on the Effects of Atomic Radiation (UNSCEAR) occupational and public exposures to radiation from electricity generation are higher in the coal industry (UNCLEAR, 2022).
Only about 20% of the general public’s exposure to radiation is caused by human activity. Less than 1% is due to the fallout from past testing of nuclear weapon and the generation of electricity in nuclear, coal, and geothermal power plants. On average, nuclear power workers receive a lower annual radiation dose than do flight crews and many frequent flyers on international airlines. The average dose received by the public from nuclear power is 10,000 times smaller than the total yearly dose received from background radiation (World Nuclear Association, 2022).
Accidents
Accidents in the energy sector occur in the mining and extraction of fuels (oil, coal, gas, and uranium), the transport of raw materials and infrastructure materials, and the construction and operation of power plants. Separate studies have found that, worldwide during 1970-92, deaths of on-the-job workers amounted to 39 in nuclear power plants and 6,400 in coal-fired power plants. Over the same period, deaths of on-the-job workers and members of the general public were 1,200 for natural gas, and deaths of members of the general public were 4,000 for hydro.
Employment
The contribution of an industry to employment in a particular geographic area comprises its effects on direct employment (those employed within the industry and within the geographical area under consideration), indirect employment (those employed in companies supplying goods and
services to the industry), and induced employment (those supplying goods and services purchased in the area by the direct and indirect labour force). On average, for every 10 direct jobs created by the nuclear industry, a further 9 indirect and 14 induced jobs are created. Elmsley (2022) argues that, taking direct and indirect employment into account, nuclear “will employ perhaps more than three times as many workers as a wind fleet of the same capacity. Also, wind will generate over 40% less induced employment than nuclear.”
Illustrative results for nuclear energy
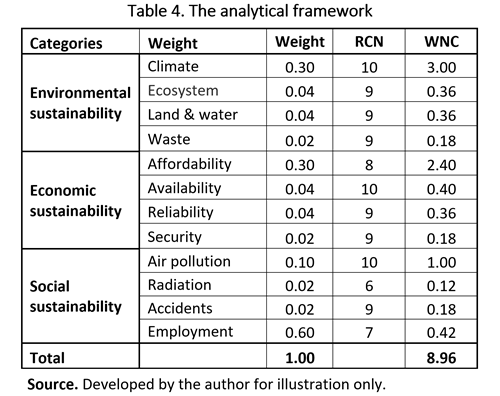
Table 4 provides a sample, summarised presentation of WNCs and OS for nuclear energy. The WNCs are derived by multiplying the weights and RNCs for each criterion. The OS is then obtained by summing the individual WNCs. When similar exercises are conducted for other primary energy resources a tentative ranking of the resources for the particular scenario envisaged can be obtained.
CONCLUSIONS
This article provides a brief history of the nuclear energy industry, develops a framework for analysing the relative merits of the fossil fuel, nuclear, and intermittent energy industries, and provides some information (mainly about the nuclear industry) needed to apply this framework. The tentative conclusions, which apply mainly to the generation of electricity (about 20% of primary energy) are:
On environmental sustainability grounds, energy from nuclear fission is better than that from fossil fuels and may be about the same as for energy from intermittent renewables. When the whole production/life cycle is considered, nuclear emits less carbon dioxide than fossil fuels and solar, and about the same as wind. Nuclear produces the lowest rates of eutrophication and acidification, the main sources of adverse effects on ecosystems. It uses very little land, especially when the in-situ method is used to mine uranium ore, and its high use of water can be offset by locating energy generating power plants in areas where water is not a scarce resource. The volume of waste produced by nuclear is small compared to both fossil fuels and intermittent renewables. Fear of radioactivity being released from waste is a widespread, but secure and reliable processes are now available to store, transport, and dispose safely the small amount of radioactive waste that nuclear produces.
In the area of economic sustainability, nuclear energy is better than both fossil fuels and intermittent renewables. Based on estimates made by the US Institute for Energy Research, when all costs including especially system costs are considered, electricity from nuclear fission is 15% cheaper than that from fossil fuels and more than 60% cheaper than electricity from intermittent renewables. With respect to resources available to future generations and including the provision of infrastructure. Nuclear uses more concrete than the fossil fuel industries but much less steel, aluminium, and copper. Compared to the intermittent renewables, it uses only 23% as much copper, 18% as much steel, 10% as much concrete, and 1% as much aluminium. Nuclear is the most reliable energy source for generating electricity. Its plants operate at full capacity more than 90% of the time, twice the rate for fossil fuels, and about three times the rate for intermittent renewables. Nuclear also provides energy security. Its fuel source - uranium – can be obtained from a wide range of countries, and its high energy density makes it is easy to maintain a stockpile that can meet energy needs for several years.
Social sustainability in the energy sector relates to the effects of energy generation on health as a result of air pollution, radioactivity, and accidents as well as the effects on employment. Considering these effects, energy from nuclear is on a par with energy from both fossil fuels and intermittent renewables. Nuclear power plants emit virtually no air pollutants and have successfully adopted practices that result in minimal mortality from radiation. Deaths of workers and members of the general public from accidents are a small fraction of those that occur in the fossil-fuel and hydro industries. Nuclear employs less people in mining than do the fossil fuel industries, but it provides opportunities for more highly skilled workers in the later stages of the production life cycle than do other energy-generating industries.
The article does not address the huge elephant in the energy sector room. A full 25 years after the Kyoto Protocol was adopted, seven years after the Paris Agreement was adopted, and following decades of policies and activism both favouring intermittent renewables and demonising most other forms of energy, intermittent renewables account for only 4.3% % of all primary energy generation. Over the coming three decades, the global population is forecast to rise by 1.9 billion (25%) and per capita incomes could increase strongly in the emerging economies, where income elasticities of demand for energy are high. How is it possible that, by 2050, two energy resources that are intermittent in supply, have very low capacity ratios, and are hugely land intensive not only replace the current supply of energy from fossil fuels and perhaps also nuclear, but also meet the growth of global demand for energy? Miracles do occur, but of this magnitude? The question is important. If the supply of intermittent renewables does not increase as hoped and projected, and if investment in fossil fuel and nuclear energies are curtailed, energy scarcities will emerge and grow. Energy prices will rise, channelling scarce supplies to those on higher incomes. This will inevitably lead to increasing social unrest which, if the supply shortage is great and long enough, could lead to a genuine existential crisis.
The elephant will be addressed in the following two articles in this series on Primary Energy Markets.
REFERENCES
Antonini, J. (2022). Nuclear Wasted: Why the Cost of Nuclear Energy is Misunderstood.
https://www.mackinac.org/blog/2022/nuclear-wasted-why-the-cost-of-nuclear-energy-is-misunderstood.
Birol, F. (2021). IEA. The World Energy Outlook, 2021. https://www.iea.org/reports/world-energy-outlook-2021.
Editors (2022). BP’s Statistical Review of World Energy (2022). https://www.bp.com/en/global/corporate/energyeconomics/statistical-review-of-world-energy.html.
Editors (2022). Energy explained. https://www.eia.gov/energyexplained/nuclear.
Editors (2022). US Office of Nuclear Energy (2022). Nuclear fuel facts: uranium. https://www.energy.gov/ne/nuclear-fuel-facts-uranium.
Elmsley, I. (2020). Employment in the Nuclear and Wind Electricity Generating Sectors. file:///C:/Users/gusho/OneDrive/01%20GCA/03_%20National%20Policies/01%20Energy/01%20Industries/04%20Nuclear/2202.11.11_Employment-in-Nuclear-Report-Final.pdf.
Energy Monitor (2022). Nuclear. https://www.energymonitor.ai/topic/nuclear.
Hooke, A. (2022). Primary energy markets – oil. https://www.ubss.edu.au/articles/2022/october/primary-energy-markets-oil.
Hooke, A. (2022). Primary energy markets – coal. https://www.ubss.edu.au/articles/2022/october/primary-energy-markets-coal.
Hooke, A. (2022). Primary energy markets – natural gas. https://www.ubss.edu.au/articles/2022/october/primary-energy-markets-gas.
Martin, C. (2020). Wind Turbine Blades Can’t Be Recycled, So They’re Piling Up in Landfills. https://www.bloomberg.com/news/features/2020-02-05/wind-turbine-blades-can-t-be-recycled-so-they-re-piling-up-in-landfills?leadSource=uverify%20wall.
Pappas, S, (2022). Uranium: Facts about the radioactive element that powers nuclear reactors and bombs. https://www.livescience.com/39773-facts-about-uranium.html.
Ritchie, H,. Rosado, P., and Roser, M. (2022). Nuclear Energy. https://ourworldindata.org/nuclear-energy.
Ulmer-Scholle, D. (2022). What is uranium? https://geoinfo.nmt.edu/resources/uranium/what.html.
Pletcher, K. (2022). Rhondda. https://www.britannica.com/place/Rhondda.
Process Industry Forum (2022). The five worst nuclear disasters in history. https://www.processindustryforum.com/energy/five-worst-nuclear-disasters-history.
Sovacool, B. (2009). Rejecting renewables: The socio-technical impediments to renewable electricity in the United States. EconPapers. https://econpapers.repec.org/article/eeeenepol/v_3a37_3ay_3a2009_3ai_3a11_3ap_3a4500-4513.htm.
Van der Merwe, B. (2022). Could the Ukraine crisis herald a rebirth for nuclear power? Energy Monitor. https://www.energymonitor.ai/sectors/power/weekly-data-rebirth-nuclear-power-renewables.
Union of Concerned Scientists (2013). A Brief History of Nuclear Accidents Worldwide.
https://www,ucusa.org/resources/brief-history-nuclear-accidents-worldwide..
United Nations (2022). Global CO2 Emissions Rebounded to Their Highest Level in History in 2021. https://unfccc.int/news/global-co2-emissions-rebounded-to-their-highest-level-in-history-in-2021#:~:text=UN%20Climate%20Change%20News%2C%209,new%20IEA%20analysis%20released%20today.
Wikipedia (2022). Nuclear energy. https://en.wikipedia.org/wiki/Nuclear.
World Nuclear Association (2022). Nuclear Power in the World Today. https://world-nuclear.org/information-library/current-and-future-generation/nuclear-power-in-the-world-today.aspx.
Zubrin, R. (2022). How we can get clean energy-What needs to be done? Quillette. https://quillette.com/2022/05/17/how-we-can-get-clean-energy-what-needs-to-be-done/
BIOGRAPHY

Angus Hooke is Emeritus Professor, Senior Scholarship Fellow, and Director of the Centre for Scholarship and Research (CSR) at UBSS. His earlier positions include Division Chief in the IMF, Chief Economist at BAE (now ABARE), Chief Economist at the NSW Treasury, Professor of Economics at Johns Hopkins University, and Head of the Business School (3,300 students) at the University of Nottingham, Ningbo, China. Angus has published 13 books and numerous refereed articles in prestigious academic journals.