
Issue 3 | Article 15
ABSTRACT
Half of human economic activity (as measured by the production of goods and services) has been generated in the last two decades. This article provides a brief overview of the 3-million-year economic history of humans, describes the present economic situation, and makes some projections of macroeconomic performance over the remainder of the 21st century. The authors suggest that continued outward movement of the global technological frontier and convergence of labour productivity across countries could cause per capita incomes to equalise at about I$ 200,000 and gross world product to exceed I$ 2 quadrillion in 2100. They argue that, at the end of this century, India will have the world’s largest economy, followed by China and Nigeria. Asia and Africa will dominate regional markets. The leading players of the late 20th century - North America, Europe, and Japan – will have quite minor roles by the end of the 21st century.
INTRODUCTION
The world economy has come a long way in a relatively short time. Only 15,000 years ago, when global warming was ending a 100,000-year ice age, the world’s population was about 4 million, foraging and hunting were the dominant economic strategies, per capita income was I$ 100, and gross world product (GWP) was equal to that of an Australian town with a little under 8,000 people. In 2020, the global population was 2 million times higher, digitisation had become the latest in a succession of new, dominant economic strategies, per capita income had risen 160-fold, and GWP was almost a million times greater. However, while looking backward makes the current GWP seem huge, looking forward makes it appear quite small. By 2100, GWP could reach I$2,100 trillion, with the world economy producing in just three weeks what it is currently making in a year.
WHERE HAVE WE COME FROM?
Using the classification proposed by Graeme Snooks (1989), humans have experienced four completed economic eras – the scavenging, hunting, farming, and industrial eras (where an era is named after the major technology contributing to the growth of its population and income). We are now well into a fifth economic era, the digital era. Table 1 provides estimates of population and per capita income on the starting boundaries of these eras. For the first era, the commencing estimates are the ending estimates for the immediate predecessor of humans, Australopithecus africanus, whose major economic activity was foraging.
Table 1. Population and income in historical economic eras
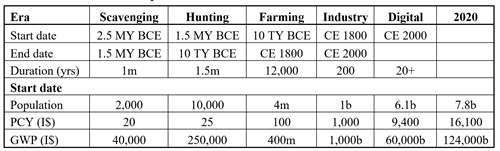
Source. Hooke & Alati (2021)
Notes. MY is an abbreviation for “million years” and TY for “thousand years”. BCE is “Before the Christian Era” and CE is “Christian Era”.
Four trends stand out. First, population growth was the major contributor to economic growth in the first three economic eras (which account for 99.6% of human history). The population rose 25 times faster than per capita income during the scavenging era, 100 times faster in the hunting era, and 25 times faster during the farming era. Second, technology – measured by per capita income growth - has been the major source of growth in the last two eras. During the industrial era, per capita income rose more than 9-fold, compared with a 6-fold increase for the population; and during the first two decades of the digital era, it grew by 71% compared with an increase of 28% for the population. Third, economic eras have generally been getting shorter – the hunting era lasted 1.5 million years, the farming era 12,000 years, and the industrial era 200 years. Fourth, the growth of GWP has been increasing – the time needed to double GWP declined from about 400,000 years in the scavenging era to 150,000 years in the hunting era, 1,000 years in the farming era, and 35 years in the industrial era. It has declined further, to 25 years, in the completed portion of the digital era.
Chart 1. Cumulative Historical GWP to 2020
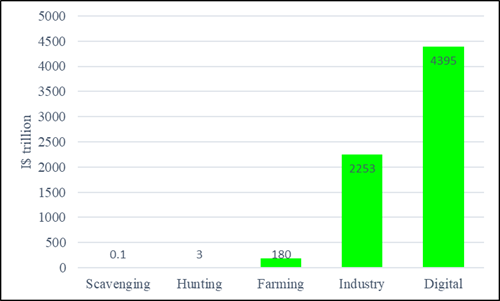
Source. Hooke & Alati (2021)
Chart 1 shows cumulative GWP through 2020. While the scavenging and hunting eras have dominated human history in terms of duration, they account for only 0.1% of historical GWP. The farming era, with a much shorter duration, produced 60 times the combined output of these earlier eras. The industrial era, which was shorter still, generated 12 times as much output as the farming era. Now the digital era, after only 20 years, has produced more goods and services than did the industrial era.
WHERE ARE WE NOW?
Table 2 shows production in the agricultural, industrial, and services sectors for the world economy, for five major geographical regions, and for the high-income countries (HICs), middle-income countries (MICs), and low-income countries (LICs) in 2020. Agriculture, which accounted for about 80% of GWP in 1800, contributed only 6% of GWP in 2020. Its share in regional production was 1% in the HICs, 8% in the MICs, and 17% in the LICs. The industry sector accounted for 30% of GWP and the services sector for 64%.
Table 2. Production in the global economy, 2020
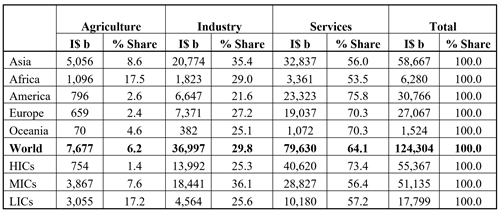
Source. UN’s Population Division, CIA’s The World Factbook, Hooke & Alati’s World Income Model.
Notes.HICs, MILs, and LICs refer to the High-Income Countries (PC GDP above I$ 30,000), Middle-Income Countries (PC GDP I$ 30,000-10,000), and Low-Income Countries (PC GDP less than I$ 10,000), respectively.
Table 3. GDP in the seven largest economies, 2020
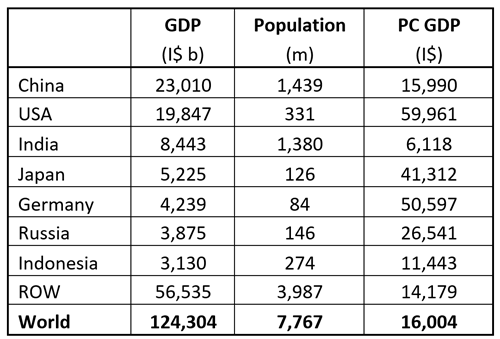
Source. UN’s Population Division, CIA’s The World Factbook, Hooke & Alati’s World Income Model.
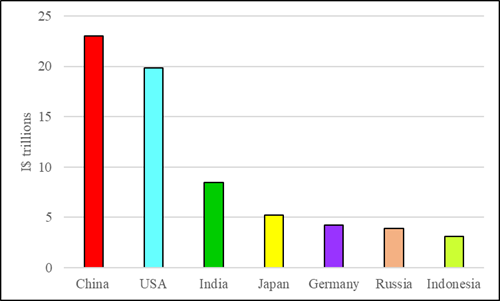
As indicated in Table 3 and illustrated in Chart 2, GDP in 2020 was highest in China (18.5% of GWP), followed by the USA (16.0%), and India (6.8%). Per capita GDP (the common measure of per capita income) among the major economies was highest in the USA, at I$ 60,000, almost four times the per capita income of China and 10 times that of India. China’s per capita income (I$ 15,990) placed it among the middle-income countries while India’s per capita income (I$ 6,120) put it in the low-income category.
Chart 2. GDP in the world’s seven largest economies, 2020

Source.Table 3.
WHERE ARE WE GOING?
The scenario outlined below has been developed from the Hooke & Alati World Income Model. This model contains estimates and projections for 168 countries comprising more than 99.5% of both the global population and GWP. The scenario assumes that the UN’s most likely projections for population will be realised, that the present political boundary will be maintained, that the technological frontier will move outward at a constant percentage rate and that the process of economic convergence will continue.
The scenario-development framework
The model from which the scenario has been derived assumes that the trajectory of a country’s labour productivity depends on (1) the country’s position relative to the global technology frontier, (2) the potential of the country to reach the frontier, and (3) the date on which it will realise this potential.
The technological frontier is measured by labour productivity in the technology-leading country. The USA is regarded as the technology leader in 2020 and is assumed to remain on the frontier for the rest of this century. It is assumed that the frontier will continue moving outward at its current rate of about 1.5% a year. This is the rate that will therefore constrain growth in the USA, and also in other countries as their labour productivity catches up with that in the USA.
The process by which countries close their labour-productivity gap with the technology leader is based on convergence theory. The convergence model divides economic eras into three phases: the breakaway, the catch-up, and the fine-tuning phase. It also divides economic agents into two categories: the technology leaders and the technology followers. The process begins with the development of new technology, such as farming 12,000 years ago or industrial technology a little more than two centuries ago. During the catch-up phase, the per capita income of the technology leaders (e.g., Western Europe and North America in the industrial era) rises but is unchanged for the technology followers. In the catch-up phase, the followers adopt the new technology and, because the technology has been improved by the technology leaders during the breakaway phase, quickly close their per capita income gap with the technology leaders. In the fine-tuning phase, where participants eke out the remaining benefits from an increasingly exhausted technology, leaders and followers have similar per capita incomes. (For a discussion of convergence theory, see Hooke [2022]).
The scenario assumes that labour productivity in most countries has the potential to converge on that in the USA during this century. To calculate the convergence trajectories, countries were classified into seven groups based on per capita income (which is the more frequently used variable in convergence theory and is closely proportional to labour productivity) in 2020 (Table 4). It is assumed that convergence takes place at a geometric rate that is constant within countries but, of course, differs across countries. Completion of the convergence process for individual countries depends on their per capita income in 2020 and ranges from 2040 for the highest-income countries (Group 1 in Table 4) to 2100 for the lowest-income countries (Group 7).
Table 4. Convergence of per capita incomes, 2040-2100
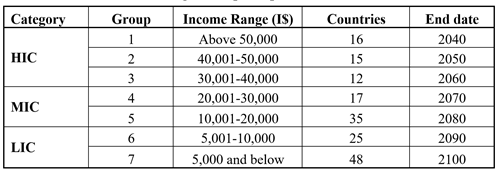
Source. Income data have been derived from the CIA’s The World Factbook. Income classifications have been made by the authors.
Special assumptions are made for highly regulated economies such as China, North Korea, and Russia, where history indicates the existence of a trade-off between political stability and economic growth. For example, China - a country that places high importance on political stability - moved into the catch-up phase of economic convergence in the early 1980s. Its GDP then increased at double-digit rates for several decades. However, those high rates were supported by an investment-to-GDP ratio of about 50%, compared to less than 20% in South Korea, Taiwan, and Hong Kong when these countries were at a similar stage of economic development. This suggests that the efficiency of investment of investment in China is relatively low. Further, most countries in the catch-up phase maintain double-digit growth rates until their per capita income reaches about 80% of that in the leading economies. However, China’s GDP growth rate started to fall when the country’s per capita income was only 20% of that of the USA. After a decade of steady decline, the growth rate is now below 5%.
Emphasis on political goals has also imposed an economic cost on Russia. Unlike China, Russia was a technology leader during the breakaway phase of the industrial era, and it has been exposed to the technologies of the leading countries for the last three decades. Nevertheless, per capita income in 2020 was 60% lower than in the USA. 40% below that in the EU, and 20% lower than in the rest of Eastern Europe. Russia’s growth of per capita income in the last decade has also been quite low. For China, North Korea, and Russia a discount factor of 5% has been applied to their potential to reach the technology frontier by 2100.
The major regions
Table 5 shows projections of production and income for the world and the five major economic regions. The scenario suggests that GWP will quadruple during the coming four decades, to I$ 545 trillion in 2060, and will then quadruple again during the succeeding four decades, to I$ 2,170 trillion in 2100. Asia will remain the largest region throughout the remainder of the century and will account for 44% of GWP in 2100. Within Asia, the share of East Asia will more than halve, to 26% (of the Asian share), reflecting sluggish growth in both China and Japan, while the share of South Asia will more than double, to 48%, due to strong growth in India and Pakistan.
Table 5. The Global Economy, 2020-2100
(2020 I$ billions)
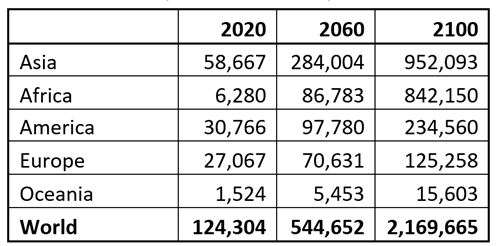
Source. The scenario developed by the authors from the Hooke & Alati World Income Model.
The big gainer will be Africa, whose share in GWP will rise from 5% in 2020 to 39% in 2100. Within Africa, the growth in the global share will be slowest in Northern and Southern Africa, with their combined regional share falling from 49% in 2020 to 14% in 2100. The fastest growth will be in Eastern Africa, whose regional share will rise from 17% in 2020 to 35% in 2100.
The rise in the global share of Africa will come at the expense of those of America, Europe, and Oceania. The share of Europe will decline from 22% in 2020 to 6% in 2100, with the largest fall being in Western Europe. For America, the reduction will be from 25% in 2020 to 11% in 2100, reflecting a decline of 23 percentage points (pp) in the regional share of North America.
Chart 3. GDP of major regions and the world, 2020-2100.
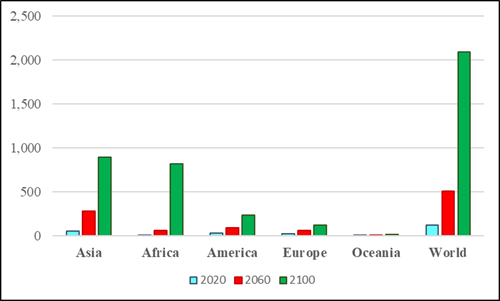
Source. Table 3.
The major countries
The modern economy emerged after the development of farming allowing humans to move from a nomadic to a settled lifestyle, farming villages to grow into towns and cities that supported specialised manufacturing and services sectors, and governments to form that provided ownership protection for the inputs and outputs of economic endeavours. The first economies, the dozen or so city-states of Mesopotamia, date back to about 4000 BCE. Mesopotamia provided the world’s largest economy for a thousand years. In the third millennium BCE, its city-states were succeeded at the top of the GDP ladder by the economies of Egypt and the Indus Valley. During the last 4,000 years, China appears to have had the largest economy for about half the time (four separate occasions), with Rome, India (three separate occasions), Great Britain, and the USA dominating during the remainder of the period (Hooke, 2021).
Table 6. The world’s largest economies, 2020-2100
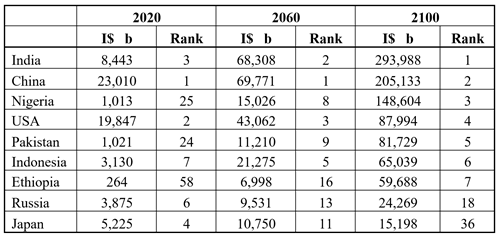
Source. The scenario developed from the Hooke & Alati World Income Model
In 2014, the GDP of China passed that of the USA, returning China to its long-standing position on the top rung of the global GDP ladder. According to the scenario outlined in this article, China will retain this position until the mid-2060s, at which time its GDP will be surpassed by that of India. By 2100, India’s GDP will be 294 trillion, 36% larger than that of then-second-placed China (Table 4). Nigeria, which currently has the biggest economy in Africa, will have the third-largest economy in the world in 2100. It will be followed by the USA, Pakistan, Indonesia, and Ethiopia. Russia and Japan which were major economies in the latter half of the 20th century, will each account for only about 1% of GWP in 2100 (Chart 4).
Chart 4. The world’s seven largest economies, 2100
Source.Table 46.
The composition of the output
The share of agriculture in GWP, which was 6% in 2020, will be less than 1% in 2100. Table 7 implies that the average annual growth rate (AAGR) of agricultural production will be 1.1% in the four decades to 2060 and will fall further to 0.1% in the last four decades of the century. In 2100, agriculture will be a boutique industry.
Table 7. Composition of GWP, 2020-2100
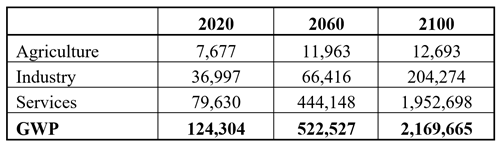
Source. The scenario developed by the authors from the Hooke & Alati World Income Model.
Two factors are driving the declining importance of agriculture. First, population growth - the cause of many doomsday forecasts in earlier centuries (MacRae, 2022) - peaked in 1969 at 2.1%. It declined to 1.0% in 2020 and is projected to fall further to 0.7% in 2021-60 and 0.1% in 2061-2100. Second, per capita consumption of farm products, measured at the farm gate, levels off at a little under I$ 1,200 when per capita income reaches I$ 20,000. The HICs reached this threshold in the 1990s, the MICs will do so in the 2030s, and the LICs will reach it by 2050. In the latter half of the century, consumption (and therefore also production) of farm products will grow at the same negligible rate as the population.
Chart 5. The composition of GWP, 2020-2100
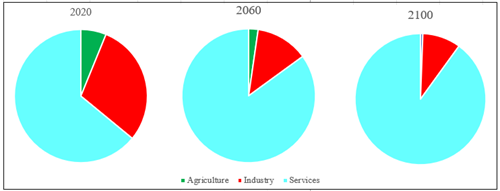
Source. Table 7.
While the decline in agriculture will be unwelcome news to owners of farmland (ultimately, it is the rents that accrue to land owners that bear the effects of changes in the prosperity of the farm sector), it also provides an opportunity to replenish the carbon storage capacity of the world’s forests.
Land currently used for farming amounts to about 4.5 billion hectares or approximately 30% of the world’s land mass. About 1 billion hectares have come from land that in the pre-farming era was plains and the remainder from land that was under forests and shrubs. Since Urban Built Up Areas (UBBA) use only 0.2 billion hectares of land, the modest future expansion of the world’s population will have a negligible impact on the total demand for land.
However, there is considerable scope for increasing land productivity, and thus for releasing land from the farm sector. Convergence of farm resources and practices as incomes rise in the MICs and LICs will more than double land productivity (Diamandis, 2012) and recently developed technologies such as precision farming, genetically modified organisms, vertical farming, and 3D printing could have a similar or greater effect. Competition among the diminishing number of farmers seeking to remain in the industry will ensure that these newer technologies are implemented and that additional technologies continue to emerge.
If land productivity were to grow at 2.3% a year, which was the average rate over the last 60 years, land released from farming would amount to 1.7 billion hectares by 2060 (a third of all current farmland) and 3.3 billion hectares by 2100 (three-quarters of current farmland), Since there is no other significant demand for this land, it will inevitably return to forests and shrubs, the quality of which will depend on how well the transition is made. With careful planning, the transition could be managed so as to maximise carbon storage and minimise forest fires. The carbon storage capacity of forests in 2100 could then equal that in the pre-farming era (Hooke, Whateley, and West, 2021). It would be expensive to do this, but one can envisage a scenario in which people who are concerned about the environment leave bequests that support named and managed areas of forest, and companies or trusts are established to organise products for these bequests and to plant and manage the forests.
CONCLUSIONS
The main conclusions of the above scenario are: (1) GWP will increase 17-fold during the remainder of the 21st century, to about I$ 2,160 trillion in 2100; (2) the greatest increases and the largest markets will be in Africa and South Asia; (3) the Indian economy will become the biggest in the world in the 2060s and in 2100 will be almost 40% larger than the second-placed Chinese economy; (4) Nigeria’s GDP will be third largest from the middle 2080s; (5) the economic powerhouses of the latter 20th century – the United States, Europe, Japan, and Russia - will account for only 11% of GWP in 2100; and (6) agriculture’s share of GWP will decline to less than 1%, and (7) land released from farming will provide an opportunity to restore the carbon-storage capacity of the world’s forests to their pre-farming level during the latter half of the 21st century.
The conclusions of this analysis are derived from a scenario that is based on specific assumptions about technology and population growth, workforce participation, and labour productivity convergence. Different assumptions will produce different scenarios and therefore different conclusions. It is hoped that, by making assumptions explicit and quantifying their implications, the article can help businesspersons and public policy makers acquire a clearer understanding of the future world economy and that this in turn can contribute to improved business and public-policy decisions.
REFERENCES
Diamandis, P. and Kotler, S. (2012). Abundance: The Future is Better Than You Think. Free Press.
FAO (2021). How to feed the world in 2050. Retrieved from https://www.fao.org/fileadmin/templates/wsfs/docs/expert.
Hooke, A. (2019). Global Economic Development: Past. Present, and Future. Lakeland House.
Hooke, A. and Alati, L. (2021). Technological Breakthroughs and Future Business Opportunities in Education, Health, and Outer Space. IGI Global.
Hooke, A. (2022). Can the digital revolution and working from anywhere help Nepal become the Switzerland of South Asia? in Updating and Enhancing Course Content, Course Delivery, and Academic Management? Smart Questions.
Hooke, A. and Alati. (2020), L. The economies of East Asia, in Emerging Business and Trade Opportunities Between Oceania and Asia. IGI-Global.
Hooke, A. and Kaur, H. Australia’s latest and most important trade agreement, in Updating and Enhancing Course Content, Course Delivery, and Academic Management. Smart Questions.
Hooke, A., Whateley, G., and West, A. (2022). The rise and fall of farming, in Updating and Enhancing Course Content, Course Delivery, and Academic Management. Smart Questions.
MacRae, D. (2022). Thomas Robert Malthus. https://www.britannica.com/biography/Thomas-Malthus.
Snooks, G. (1989). The dynamic society, Routledge.
BIOGRAPHIES

Angus Hooke is an Emeritus Professor, Senior Scholarship Fellow, and Director of the Centre for Scholarship and Research (CSR) at UBSS. His earlier positions include Division Chief in the IMF, Chief Economist at BAE (now ABARE), Chief Economist at the NSW Treasury, Professor of Economics at Johns Hopkins University, and Head of the Business School (3,300 students) at the University of Nottingham, Ningbo, China. Angus has published 12 books and numerous refereed articles in prestigious academic journals.

Lauren Alati is the Lead Consultant at Argon & Co., a world-leading consultant headquartered in Paris with global offices in Atlanta, London, Mumbai, and Melbourne. She is certified in Logistics, Transport and Distribution with APICs. Lauren also has a master’s degree in Operations and Supply Chain management from the University of Technology, Sydney, and an honours degree from the University of Nottingham. She has authored articles and book chapters on technology, economic growth, and international trade.