
Issue 2 | Article 1
Abstract
Advances in digital technology require business students to work with larger and different forms of data and to learn new methods of detecting patterns and key associations hidden in these data. This article discusses three new algorithms that the authors believe students should study, namely, the apriori, the k-means, and the C4.5 classifier algorithms. They make a strong case for including these algorithms in curricula for quantitative methods, explain each algorithm, and discuss some of their applications. The authors argue that understanding the algorithms will equip business students with better skills and greater knowledge for success in the modern business environment.
Introduction
The advent of Big Data Analytics and associated technologies such as Robotics, Internet of Things, Artificial Intelligence, Machine Learning, Deep Learning, and Cognitive Computing, has upended the traditional syllabus for teaching quantitative methods to business students (Vowels & Goldberg, 2019). Advances in business intelligence and analytics necessitate business students to learn new methods that are fundamentally different from traditional business statistics in two main ways: (1) they are not concerned with significance testing via p-value assessments, but focus on detecting new patterns and key associations hidden in big data (Simsek, Vaara, Paruchuri, Nadkarni, & Shaw, 2019); and (2) they are designed to work with new kinds of data, known as big data, which are different from typical quantitative data in both form and structure (George, Haas, & Pentland, 2014).
In this short article, the authors discuss three algorithms: (1) the apriori algorithm, (2) the k-means algorithm, and (3) the C4.5 classifier algorithm, all of which are widely used in big data analytics across industries (Wu et al., 2007). First, they make a case for including these algorithms in the curriculum for quantitative methods. Then, they elaborate on each algorithm and explain some of their applications. The authors argue that including these algorithms in quantitative methods subjects will equip business students with much-needed skills and knowledge for success in today’s changing industries, where a major key to success is an understanding and appreciation of knowledge about big data and advanced analytics.
Why should we teach new algorithms?
The business world has entered the era of Analytics 3.0, where access to big data and the use of advanced analytics are imperative to the everyday operation of large and small firms alike (Davenport, 2018). Business schools have the crucial responsibility of equipping business students with the mindset and skills required for success in this era. As eloquently argued by Simon (1967):
“The tasks of a business school are to train men for the practice of management (or some special branch of management) as a profession, and to develop new knowledge that may be relevant to improving the operation of business” (p.1).
To this end, the authors call for a new curriculum for quantitative methods. Their proposed curriculum emphasizes analytical algorithms that are part of the movement toward Analytics 3.0. The full list of algorithms in big data analytics (see Brownlee, 2017) goes beyond the scope of this article. In what follows the authors describe three such algorithms, selected on the basis of their popularity, applicability, and more importantly their complementarity (Wu et al., 2007).
The C4.5 classifier algorithm
1. Description
C4.5 is a classifier, or decision-making tree, algorithm within the class of machine-learning techniques. It was developed by Quinlan (1993) as an improvement on the ID3 algorithm (Quinlan, 1979). In simple terms, C4.5 looks at a large set of items - such as customers, transactions, and purchases - in a dataset and develops an initial tree assuming similarity between all items. It then uses a divide-and-conquer logic to find branches between items by grouping them into smaller sets using a statistical test. C4.5 employs two heuristics to achieve this: (1) information gain, which minimizes the total entropy of the subsets; and (2) the default gain ratio, which divides information gain by the information provided in the test outcomes (Wu et al., 2007). The initial tree is then pruned to avoid overfitting. Research on C4.5 was funded for many years by the Australian Research Council, and is freely available for research and teaching (see: c4.5 algorithm download). A sample decision tree is illustrated in figure 1.0.


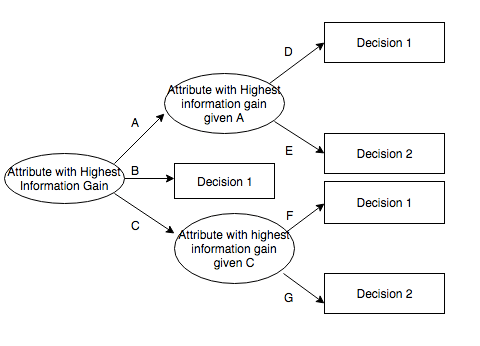
Figure 1: A sample decision tree generated by c4.5 algorithm (Source: https://www.quora.com/What-is-the-C4-5-algorithm-and-how-does-it-work)
2. Some business applications
The C4.5 algorithm has wide applications across industries. Its robustness, accuracy, and theoretical rigour allow it to be applied to a wide range of data sets. For instance, marketers can use decision trees to determine the sequence of demographics of shoppers who choose a retailer or buy a specific product range. They can use shopper panel data to determine the best age ranges of shoppers, then dig further into the income ranges in each age range, and even go further into how the choice of retailers is explained by each income range within each age range. The findings of such decision trees can help managers decide on distributions, promotions, and advertising strategies. Similarly, finance professionals can use C4.5 to develop decision trees that explain how credit cards, insurance premiums, and loan applications can be distributed to customers in terms of their occupations, demographics, and locations. Figure 2 exhibits an example of a C4.5 decision tree for mobile users of a telecommunication company.
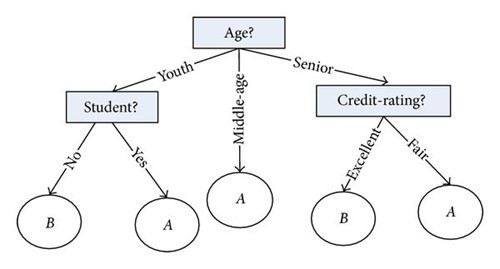
Figure 2: A decision tree generated by C4.5 algorithm for a sample of mobile users (Source: https://europepmc.org/article/med/24688389)
The apriori algorithm
1. Description
An apriori algorithm, also known as associate mining or affinity analysis, is a machine-learning tool to find itemset or explore associations between different items in a large population of transactions (Aguinis, Forcum, & Joo, 2012). It is characterized as a level-wise, complete-search algorithm which assumes that if an itemset is not frequent, none of its superset is ever frequent (Wu et al., 2007). It therefore allows researchers to identify those items that co-occur (i.e., appear together) on a frequent basis and to assess the extent to which they co-occur (Aguinis et al., 2012). The algorithm first searches for frequent occurrences. Once frequent item sets are obtained, it generates association rules with confidence larger than or equal to a user-specified minimum confidence level (Wu et al., 2007). Wu et al. (2007) explain the algorithm as follows:
“Apriori first scans the database and searches for frequent item sets of size 1 by accumulating the count for each item and collecting those that satisfy the minimum support requirement. It then iterates on the following three steps and extracts all the frequent item sets. (1) Generate Ck+1, candidates of frequent itemsets of size k +1, from the frequent item sets of size k. (2) Scan the database and calculate the support of each candidate of frequent item sets. (3) Add those item sets that satisfies the minimum support requirement to Fk+1.” (P. 12-13).
Apriori algorithm, therefore, not only can explore, mine, and discover new relationships between various attributes in a dataset but also can be used to test hypotheses about expected relationships and co-occurrences. Three complementary metrics reveal the presence, nature, and strength of an association rule: lift, support, and confidence (Aguinis et al., 2012). Lift provides information on whether an association exists as well as whether the association is positive or negative. Support shows the probability that a set of items co-occurs with another set of items in a data set. Confidence reveals the probability that a set of items occurs given that another set of items has already occurred (Aguinis et al., 2012). The algorithm is quite simple, and the metrics are easy to compute. Experimenting with apriori-like algorithms is the first thing that data miners try to do (Wu et al., 2007). Figure 3 is an illustration of a fundamental business question that can be addressed by an apriori algorithm.
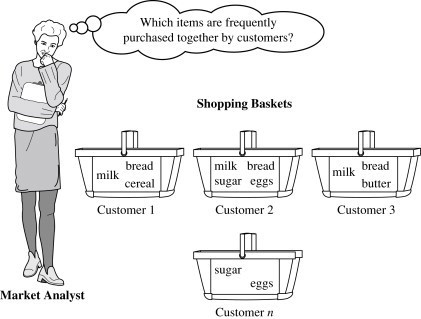
Figure 3: Apriori algortihm (Source: https://www.sciencedirect.com/topics/computer-science/market-basketanalysis)
2. Some business applications
There are many areas of business and management practice that can benefit from the use of apriori algorithms. For instance, HR managers can use employees’ records to identify conditions that occur together when employees show a high degree of turnover, unexcused absenteeism, aggregation, or loss of motivation and work engagement. Similarly, marketing managers can employ this algorithm to mine associations between products that are purchased together, websites that are visited together, and consumer attributes that exist when certain shopper behaviours occur together. Leadership scholars and practitioners can also benefit from this algorithm by exploring leaders’ attributes, behaviours, and skills that occur together under different conditions and in different contexts. For instance, apriori algorithms can be used to find associations between observable attributes of leaders who succeeded during the COVID-19 pandemic. Lastly, entrepreneurship researchers can utilize this algorithm to find a set of characteristics that occur together in successful or unsuccessful entrepreneurs or a set of skills that entrepreneurs demonstrate when raising funds. Aguinis et al. (2012) provide a more complete list of areas where management practitioners can benefit from this algorithm.
The k-means algorithm
1. Description
The k-means algorithm is a simple yet very effective clustering algorithm. It is essentially an iterative method to partition a given dataset into a user-specified number of clusters, k. (Wu et al., 2007). The algorithm starts by picking k points in a dataset and their representative or closest centroids. Then the algorithm iterates between two steps till convergence (Wu et al., 2007):
- Data Assignment. Each data point is assigned to its closest centroid, with ties broken arbitrarily. This results in a partitioning of the data.
- Relocation of “means”. Each cluster representative is relocated to the centre (mean) of all data points assigned to it.
The result of this iterative procedure is a set (k) of clearly defined groups for further analysis and informed decision making (Figure 4).

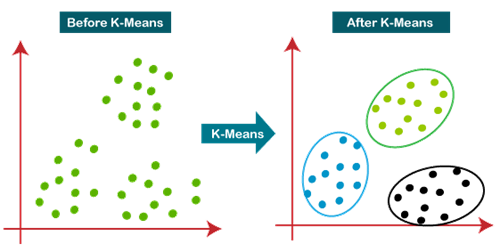
Figure 4: An illustration of KNN algorithm (Source: https://www.analyticsvidhya.com/blog/2021/04/k-meansclustering-simplified-in-python/)
The K-means algorithm is computationally fast, simple, and very effective, making it a widely used method for segmentation, clustering, and grouping purposes.
2. Some business applications
A k-means algorithm is a powerful clustering algorithm. It can be used by marketing practitioners to find market segments, as well as to target markets and product groups. More importantly, the simplicity of the algorithm allows marketing managers to apply it to any set of data, such as data from online transactions and social media campaigns, in order to explore how target audiences, prospect shoppers, and existing or loyal shoppers can be grouped so as to tailor marketing offerings to their specific wants and needs. Similarly, banks can use the algorithm to find optional groups of customers in terms of their credit scores and other attributes. Lastly, operations and supply-chain research can benefit from the algorithm in ways such as grouping of suppliers in terms of their contractual obligations, delays, errors, and powers or grouping of produce defaults and defects in terms of the types and levels of damage. The results enable managers to formulate different courses of actions for each cluster, which in turn improves the effectiveness and efficiency of operations
Concluding remarks
In this short article, the authors illustrated how three algorithms from the field of machine learning and big data analytics can provide business students with a set of analytical skills that is essential in todays’ data-driven job markets. It serves as a starting point for including more advanced analytics in the syllabus of business statistics and quantitative methods in order to train students to make better decisions and tackle more sophisticated business problems using more advanced analytical tools.
References
Aguinis, H., Forcum, L. E., & Joo, H. (2012). Using Market Basket Analysis in Management Research. Journal of Management. doi:10.1177/0149206312466147.
Brownlee, J. (2017). Master Machine Learning Algorithms: Discover How They Work and Implement Them From Scratch. Melbourne, Australia: Mastery Machine Learning Series.
Davenport, T. H. (2018). From analytics to artificial intelligence. Journal of Business Analytics, 1(2), 73-80. doi:10.1080/2573234x.2018.1543535.
George, G., Haas, M. R., & Pentland, A. (2014). Big Data and Management. Academy of Management Journal, 57(2), 321-326. doi:10.5465/amj.2014.4002.
Quinlan, J. R. (1979). Discovering rules by induction from large collections of examples. In D. Michie (Ed.), Expert systems in the micro electronic age. Edinburgh: Edinburgh University Press.
Quinlan, J. R. (1993). C4.5: Programs for machine learning. San Mateo, USA: Morgan Kaufmann Publishers.
Simon, H. A. (1967). The Business School A Problem In Organizational Design. The Journal Of Management Studies, 4(1), 1-16.
Simsek, Z., Vaara, E., Paruchuri, S., Nadkarni, S., & Shaw, J. D. (2019). New Ways of Seeing Big Data. Academy of Management Journal, 62(4), 971-978. doi:10.5465/amj.2019.4004.
Vowels, S. A., & Goldberg, K. L. (Eds.). (2019). Teaching Data Analytics: Pedagogy and Program Design. New York,: CRC Press.
Wu, X., Kumar, V., Ross Quinlan, J., Ghosh, J., Yang, Q., Motoda, H., . . . Steinberg, D. (2007). Top 10 algorithms in data mining. Knowledge and Information Systems, 14(1), 1-37. doi:10.1007/s10115-007-0114-2.
Biographies

 Dr Arash Najmaei holds a PhD in strategic management and entrepreneurship from Macquarie University. He is currently working full time as a marketing consultant and teaching part time at various universities. His teaching interests include business research methods, strategic management, entrepreneurship, organizational change, and media management. Dr Najmaei’s research has been published in several journals and research books and presented at international conferences. He has also received three best-paper awards for his research in entrepreneurship and research methods.

Dr Zahra Sadeghinejad graduated with a PhD in management from Macquarie University. She is an active researcher and an award-winning lecturer. Her areas of teaching expertise include marketing, media management, entrepreneurship, and quantitative methods. Dr Sadeghi’s research has been published as book chapters and journal articles and has been presented at prestigious international conferences for which she has received multiple best-paper awards. Dr Sadeghi is currently a lecturer at the Universal Business School Sydney (UBSS), Central Queensland University (CQU), and the International College of Management Sydney (ICMS).