


Staff to Student Ratio (SSR) – Of Little Consequence and Not Helpful
Greg Whateley
Andrew West
We have argued for a number of years now that there is little if any relationship between quality teaching and learning and Staff to Student Ratios (SSR). Attempts to reduce the ratio is little more than a distraction.
Student to staff ratio is calculated as the sum of student EFTSL (excluding work experience in industry) divided by sum of staff full time equivalence (FTE) in teaching and teaching/research functions, including actual casual staff – www.heimshelp.dese.gov.au
Using our own institution as an example (over a five year period – or 17 trimesters) we have matched the Student Feedback on Units (SFUs) aggregates (internal); the QILT annual outcomes (external); and the grade distributions (internal) - and overlaid them on the changing SSR during the same period.
SFUs and SSR
The following graphs are a comparison of the Student to Staff Ratio (SSR) and the Student Feedback on Units (SFU) surveys for the period Trimester 1, 2017 to the most recent Trimester 2, 2022 (that is 6 years and 17 trimesters) –

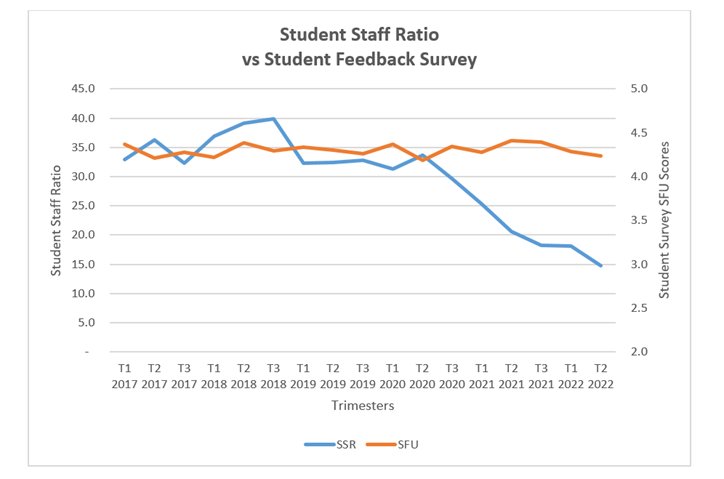
This graph shows the consistency of the SSR between 32 and 39 up until T2 2020, when COVID impacted student numbers. Since then the SSR has been in steady decline to a level of 14.7 in Trimester 2, 2022. The SFUs remained constant throughout the whole period between a tight range of 4.2 to 4.4 out of a possible 5. The correlation between these two variables is -0.17. This indicates a negative, weak correlation. There is no impact of lower SSRs.
QILT and SSR
The Quality Indicators for Learning and Teaching (QILT) surveys are an annual request for feedback from all students at universities and independent higher education institutions who chose to join. Since 2016, our School has been involved in the QILT Student Experience Survey. “The SES is the only comprehensive survey of current higher education students in Australia. It focuses on aspects of the student experience that are measurable, linked with learning and development outcomes, and potentially able to be influenced by higher education institutions. Information collected in the SES helps higher education institutions and the government improve teaching and learning outcomes for students.” - www.qilt.edu.au/surveys/student-experience-survey
The following graphs are a comparison of the Student to Staff Ratio (SSR) and the QILT Student Experience Survey for each year from 2017 to 2021 - which includes the latest results available for QILT.
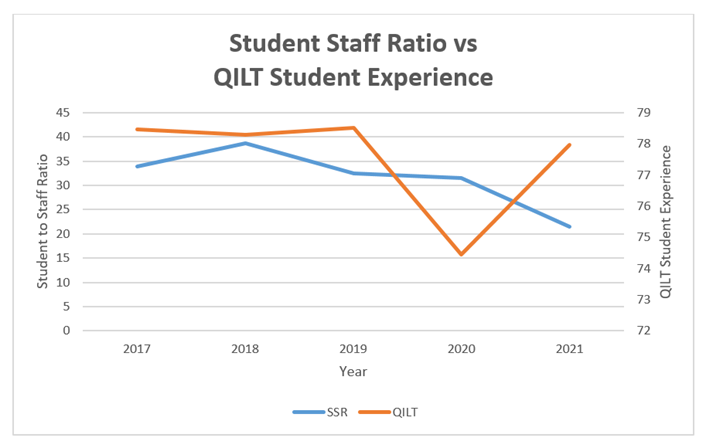
The line graph for SSR shows the same steady level of SSR in 2017 – 2020, in an annual range between 31.6 and 38.6. There is a steep decline in the SSR in 2021 to 21.4. The QILT SES score is consistently high between 78.3 and 78.5. There was a drop in the 2020 survey to 74.4, due to the negative impact of COVID. In 2021, the QILT SES rebounded to 78. There is no correlation between SSR and QILT with an r = 0.09. It can be seen that the impact on QILT is due to a range of other factors (mostly COVID) and nothing to do with the SSR.
Grade Distribution and SSR
The following graphs are a comparison of the Student to Staff Ratio (SSR) and Grade distribution (progression) for the period Trimester 1, 2017 to the most recent Trimester 2, 2022 (6 years/17 trimesters)
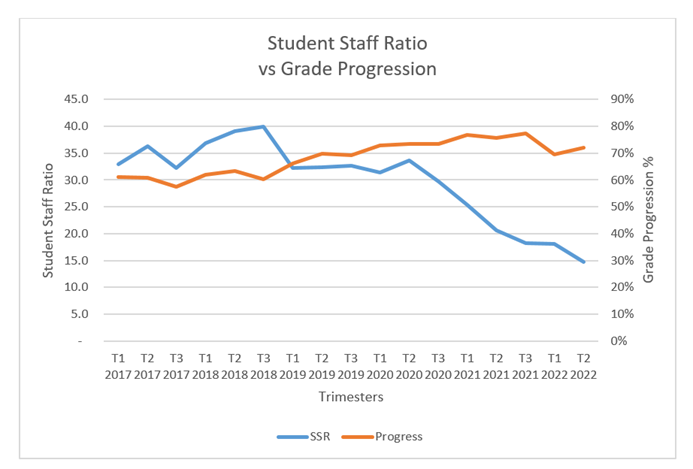
This graph shows the consistency of the SSR between 32 and 39 up until T2 2020, when COVID impacted student numbers. Since then the SSR has been in steady decline to a level of 14.7 in Trimester 2, 2022. The grade progression was a band of between 57% - 63% up to the end of 2018. The grade progression, then, steadily improved to a high of 77% by Trimester 3, 2021. During the time from mid-2020 the SSR steadily decreased.
For 2022, as the SSR dropped to its lowest level of 14.7, the grade progression dropped back to 70%, reversing the previous trend. The correlation between these two variables is - 0.66. Which indicates a negative, moderate correlation.
What we can clearly see is that the SSR is essentially irrelevant and bears no impact on student feedback and performance. Amongst a flurry of suggestions on how to improve student satisfaction has been the suggestion to reduce the SSR – a waste of effort! The focus needs to be on quality teaching and learning that is well done by our private providers – but poorly done by our research focused institutions. If you want to engage students - put the time and effort into that very thing.
Emeritus Professor Greg Whateley is the Deputy Vice Chancellor (Universal Business School Sydney/Melbourne) and Vice President (Academic) at Group Colleges Australia.
Dr Andrew West is an Adjunct Professor at the Universal Business School Sydney/Melbourne.