


Understanding the Yield Curve: Navigating Economic Trends in Financial Markets
In the complex world of finance, the yield curve emerges as a critical tool, offering insights into future economic conditions. Primarily, it serves as a graphical representation that plots the yields or interest rates across bonds of identical credit quality but varying maturities. Among various yield curves, the one about U.S. Treasury debt holds significant attention due to its implications on the economy.
The Anatomy of the Yield Curve
At its core, the yield curve is a line chart that maps out the interest rates of bonds, with the same risk level, across different time horizons. This curve is pivotal for investors, policymakers, and economists alike as it provides a snapshot of the market's expectations regarding future interest rates and economic growth.
The Significance of the 10-Year to 2-Year Spread
Among the various spreads within the yield curve, the difference between the yields on 10-year and 2-year U.S. Treasury bonds stands out for its predictive power regarding economic recessions. This particular spread is favoured by many as a reliable indicator of forthcoming economic downturns, a perspective supported by historical data and some Federal Reserve officials. The rationale behind this preference lies in the belief that shorter-term maturities offer a clearer view into the immediate future of the economy.
Decoding an Inverted Yield Curve
An inversion of the yield curve, where long-term interest rates fall below short-term rates, signals a noteworthy shift in investor sentiment. Historically, such inversions have often preceded recessions in the United States. This phenomenon reflects the collective expectation of investors for a downtrend in longer-term interest rates, driven by anticipated declines in economic performance.
It is important to highlight the fact that recessions normally start when the yield curve normalises and reinverts.
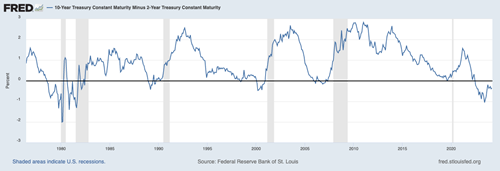
*Source: Federal Reserve Bank of St. Louis
**Shaded areas indicate U.S. recessions.
Current Dynamics: Interpreting the Inverted Yield Curve
As of late 2022, amidst rising inflation rates, the yield curve witnessed another inversion. Notably, the 10-year U.S. Treasury rate dipped below the two-year yield by 0.26 percentage points. While this inversion has slightly narrowed compared to its previous state, it remains a subject of intense scrutiny.
The ongoing inversion has sparked a debate among economists and market participants regarding its implications for the U.S. economy. On one hand, several economists view this as a precursor of a looming recession, drawing on the historical correlation between yield curve inversions and economic downturns. On the other hand, there is a growing belief that the current state of the yield curve might be painting a different picture. The argument here is that the narrowing of the inversion could signal a growing confidence among investors that the peak of inflation has been surmounted and that a return to economic normalcy is on the horizon.
In conclusion, the yield curve remains an indispensable tool for decoding the complexities of economic forecasts. Whether signalling caution or optimism, its movements provide valuable insights into the collective mindset of investors and their expectations for the future. As we navigate through the uncertainties of the global economy, understanding the nuances of the yield curve is more crucial than ever for making informed financial and investment decisions.
Associate Professor Mordechai Katash is an Associate Program Director at UBSS Melbourne CBD Campus